Lab 6: Intro to Interactive Mapping (Part II)
Overview
Submission
Please carefully read the instruction and play with Mapbox examples 7-11. These examples are using the same data and are developed from a simple interactive map (e.7) to more complicated one (e.11) with more functions. Please carefully compare them and understand what are the new functions & scripts have been added gradually.
The zip file with Lab 6 materials can be found here: https://github.com/fuzhen-yin/uccs_cartography/blob/main/lab_materials/lab6.zip
(Don’t know how to download the data? Please read: Lab 4 - Overview)
At the end of the lab, you are required to:
- To replicate “Mapbox_example9.html” using the same
“Bike Route” data and “Pedestrian & Bicycle Counts” data by:
- changing base map styles
- change circle size & color
- change label size & color
- Create a draft map for your midterm project using
your own data, by:
- creating a new base map style
- upload your data as a new tileset to mapbox
- developing the code step by step: - create the base map - add a new data layer to your map - styling the data layer
- (Not Required: 5 pts) Base on the
“Mapbox_example10.html”, please create another
interactive map. In the new map, please change the slider of
years to the slider of seasons. Specifically,
when users change the sliders, the map can display counts of pedestrian
& bikes in different seasons.
# Hint: In the file “denver_count_ped_bike.geojson”, there is one column called “season” that includes four unique values [“Spring”,“Summer”,“Fall”,“Winter”]
Please submit a zip with TWO+ .html files and any supporting documents (e.g., images) to Canvas.
Interactive Map Example - Denver Bike Data
Our first Mapbox map (Example 6: Flow Map in Lab 4) has navigational interactivity only- the user can pan and zoom, but cannot change the data layers or styling of the map. The next example illustrates some more advanced data interactivity.
The data sources are:
- Denver Bike Facilities
- Denver Counts of Pedestrian & Bicycle
Creating Bike Data Tilesets
Similar to the earlier Flow Map, we are going to add Denver Bike Facilities and Bike & Pedestrian Count as Tilesets which will be hosted on Mapbox.
After downloading and unzipping Lab 6 Materials, you can find two geojson files:
- denver_bike_facilities.geojson
- denver_count_ped_bike.geojson
Hint:If you want to check what’s in the data, right click the geojson file and open it with a text editor (e.g., brackets / sublime text / notepad)…
Next upload these dataset to Mapbox individually as “New Tileset”. There will be delay while Mapbox converts these files into vector tiles (see the screenshot below).
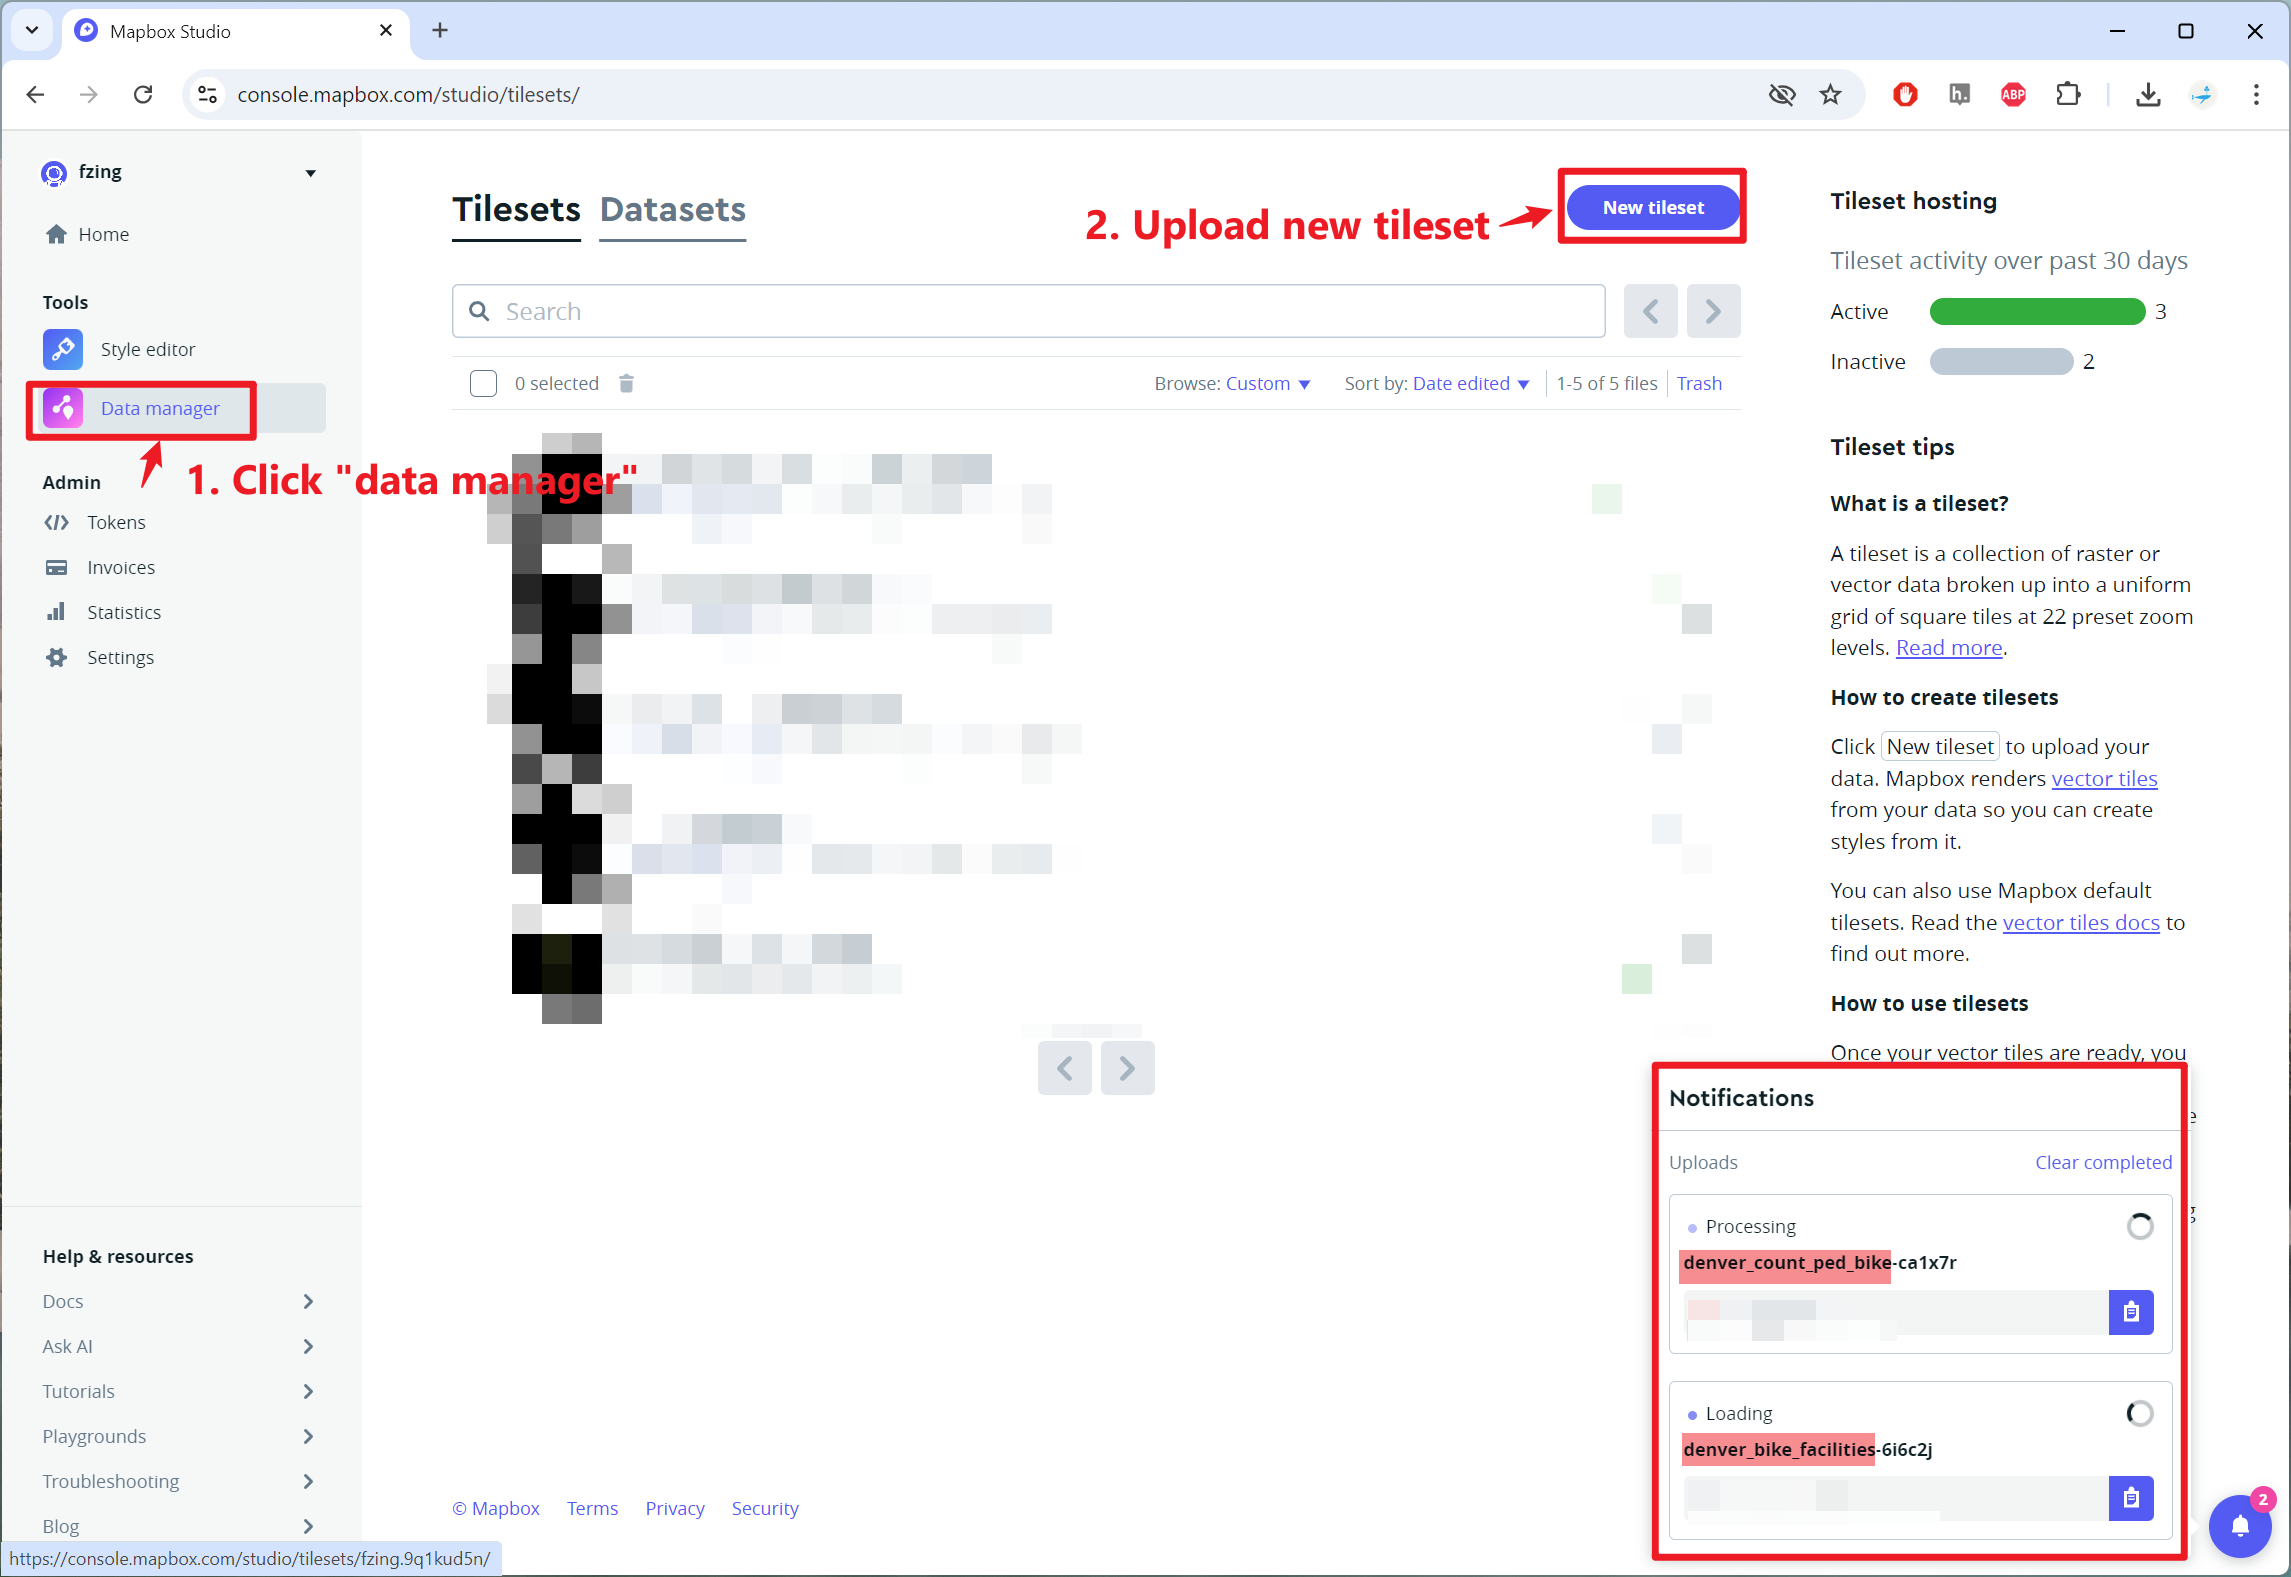
Each tileset has a unique Tileset ID and NAME.
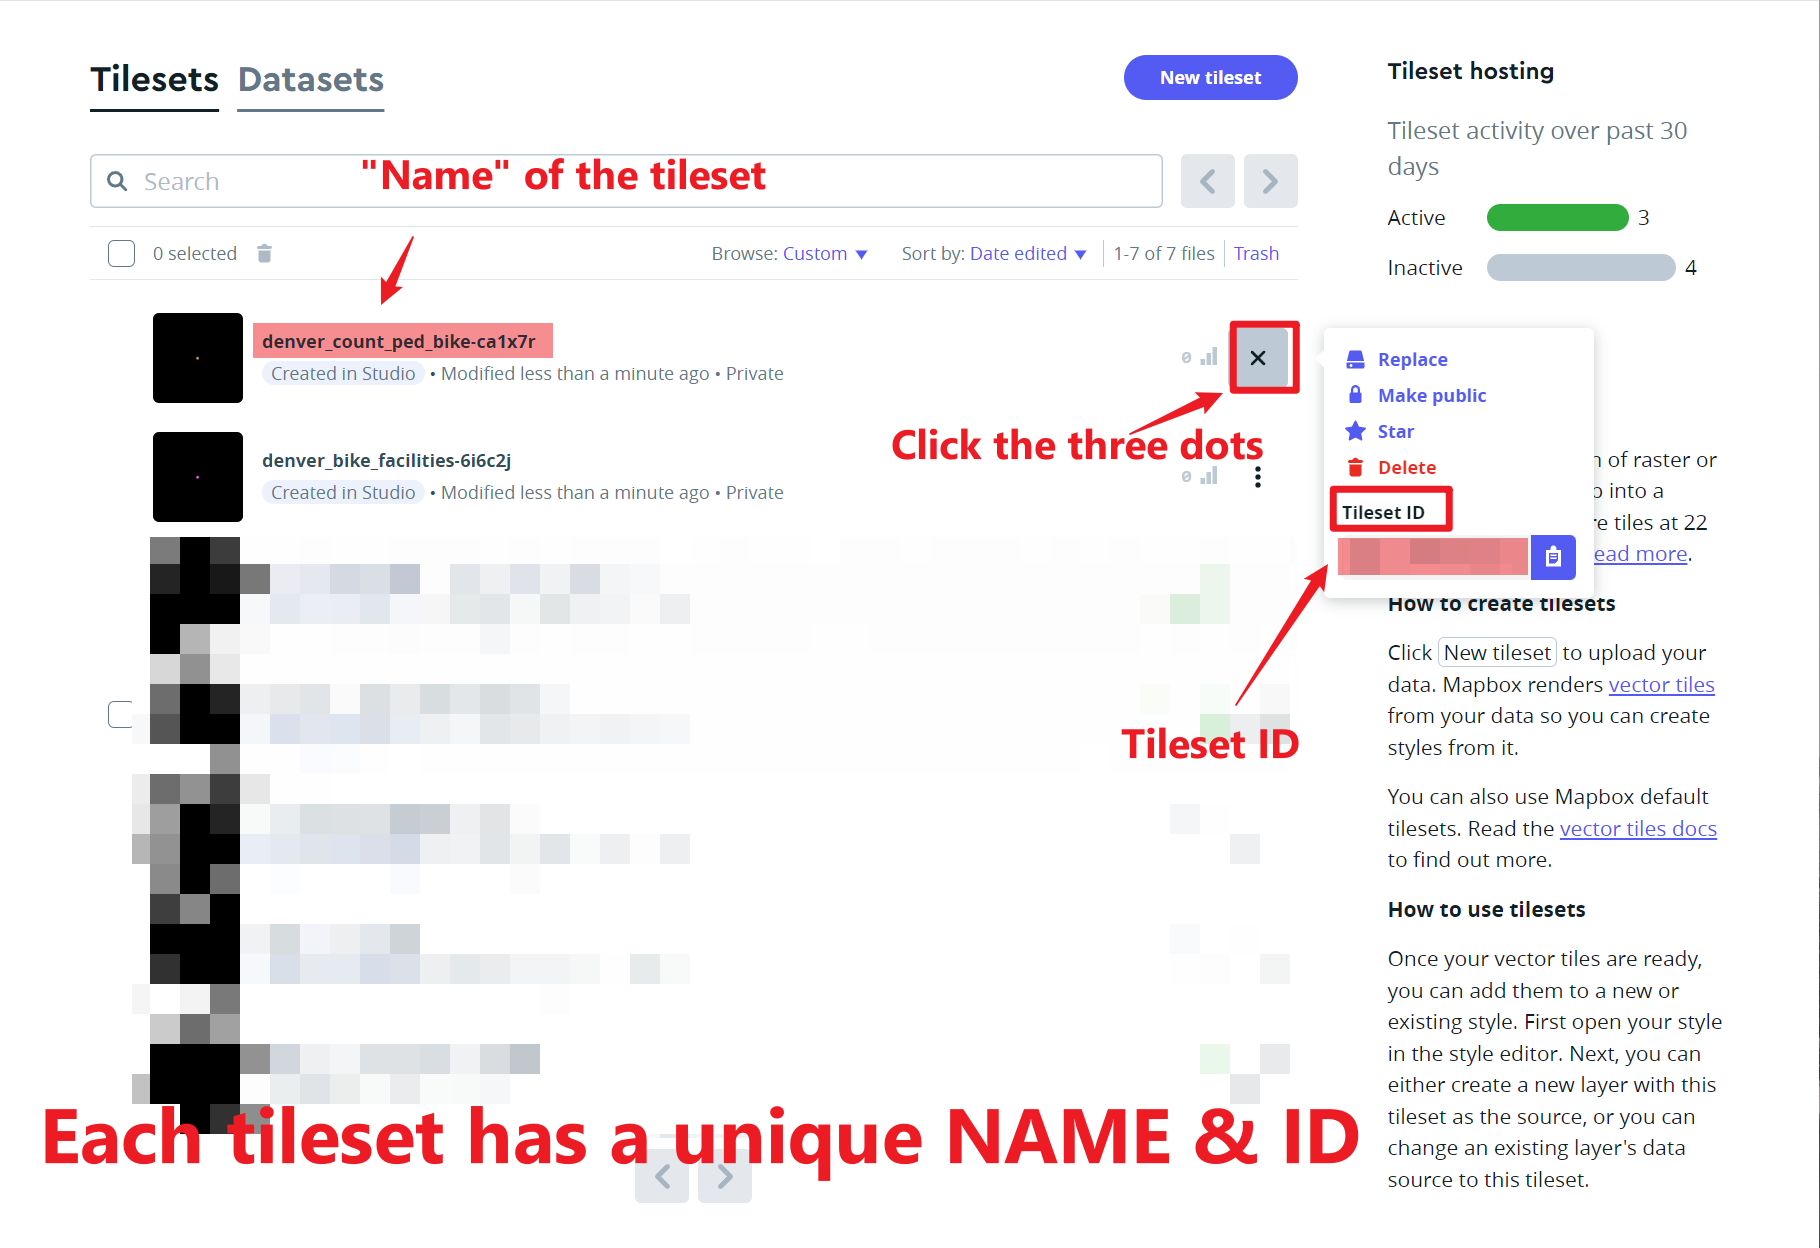
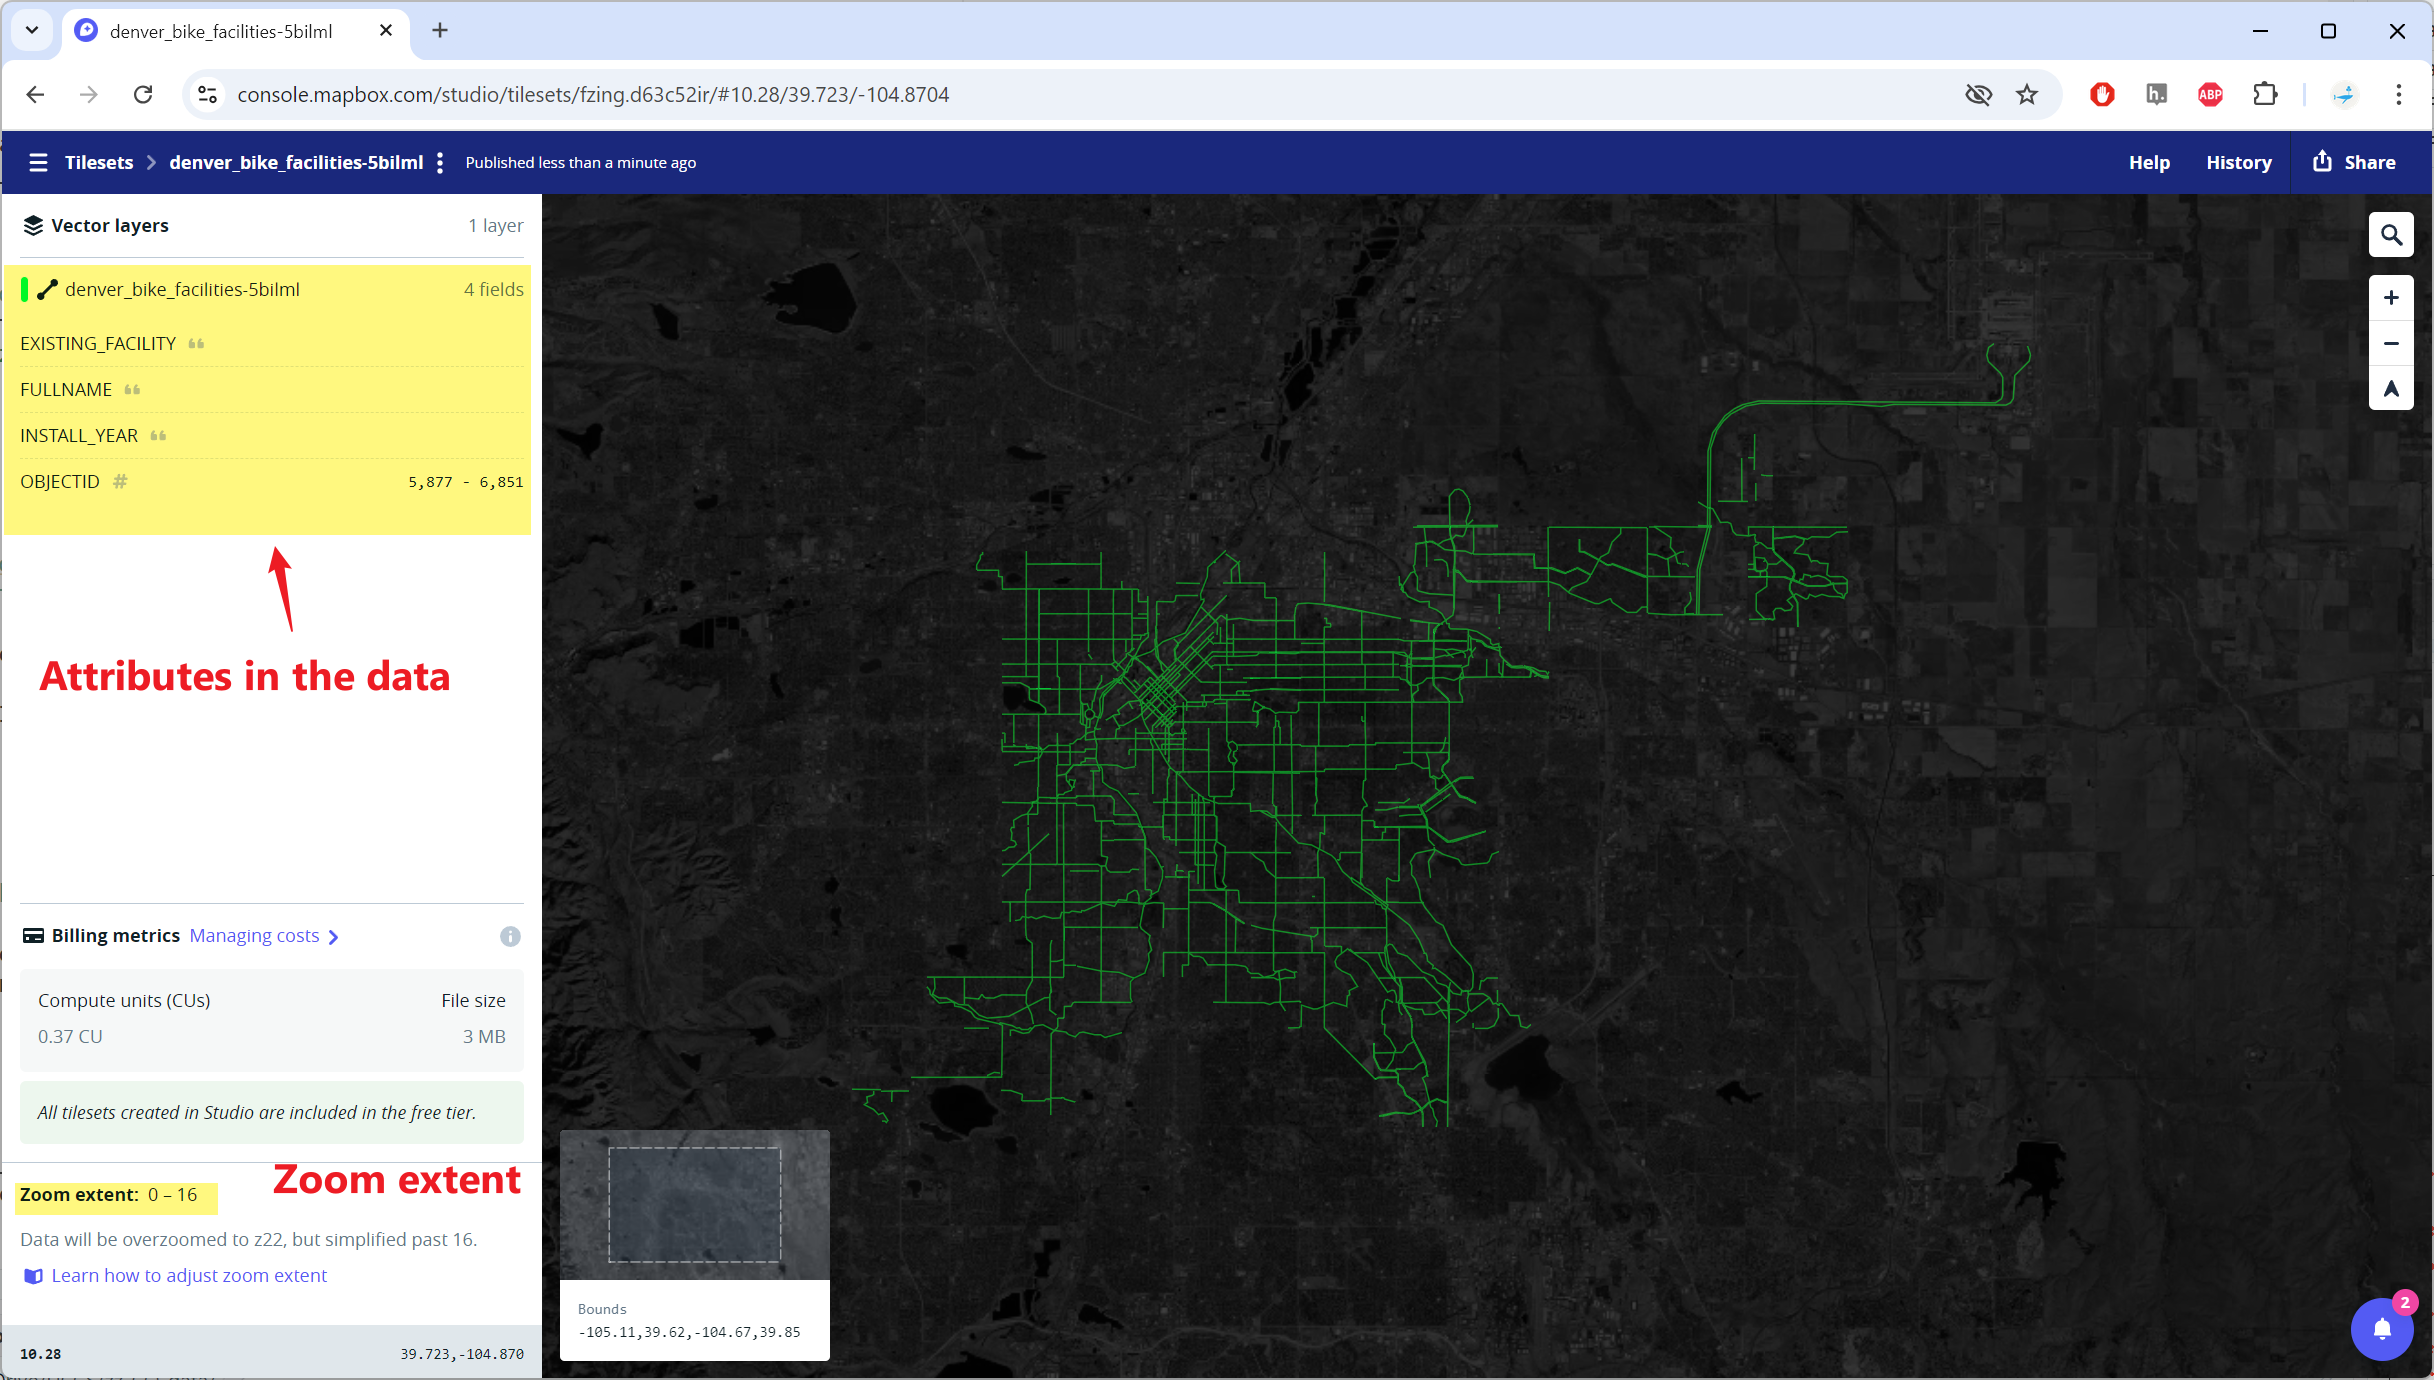
Click on the tileset to see the attributes / properties & its Zoom extent.
Creating Background Map Style
Again we are going to use Mapbox Studio to create the background map for our Bike Data visualization.
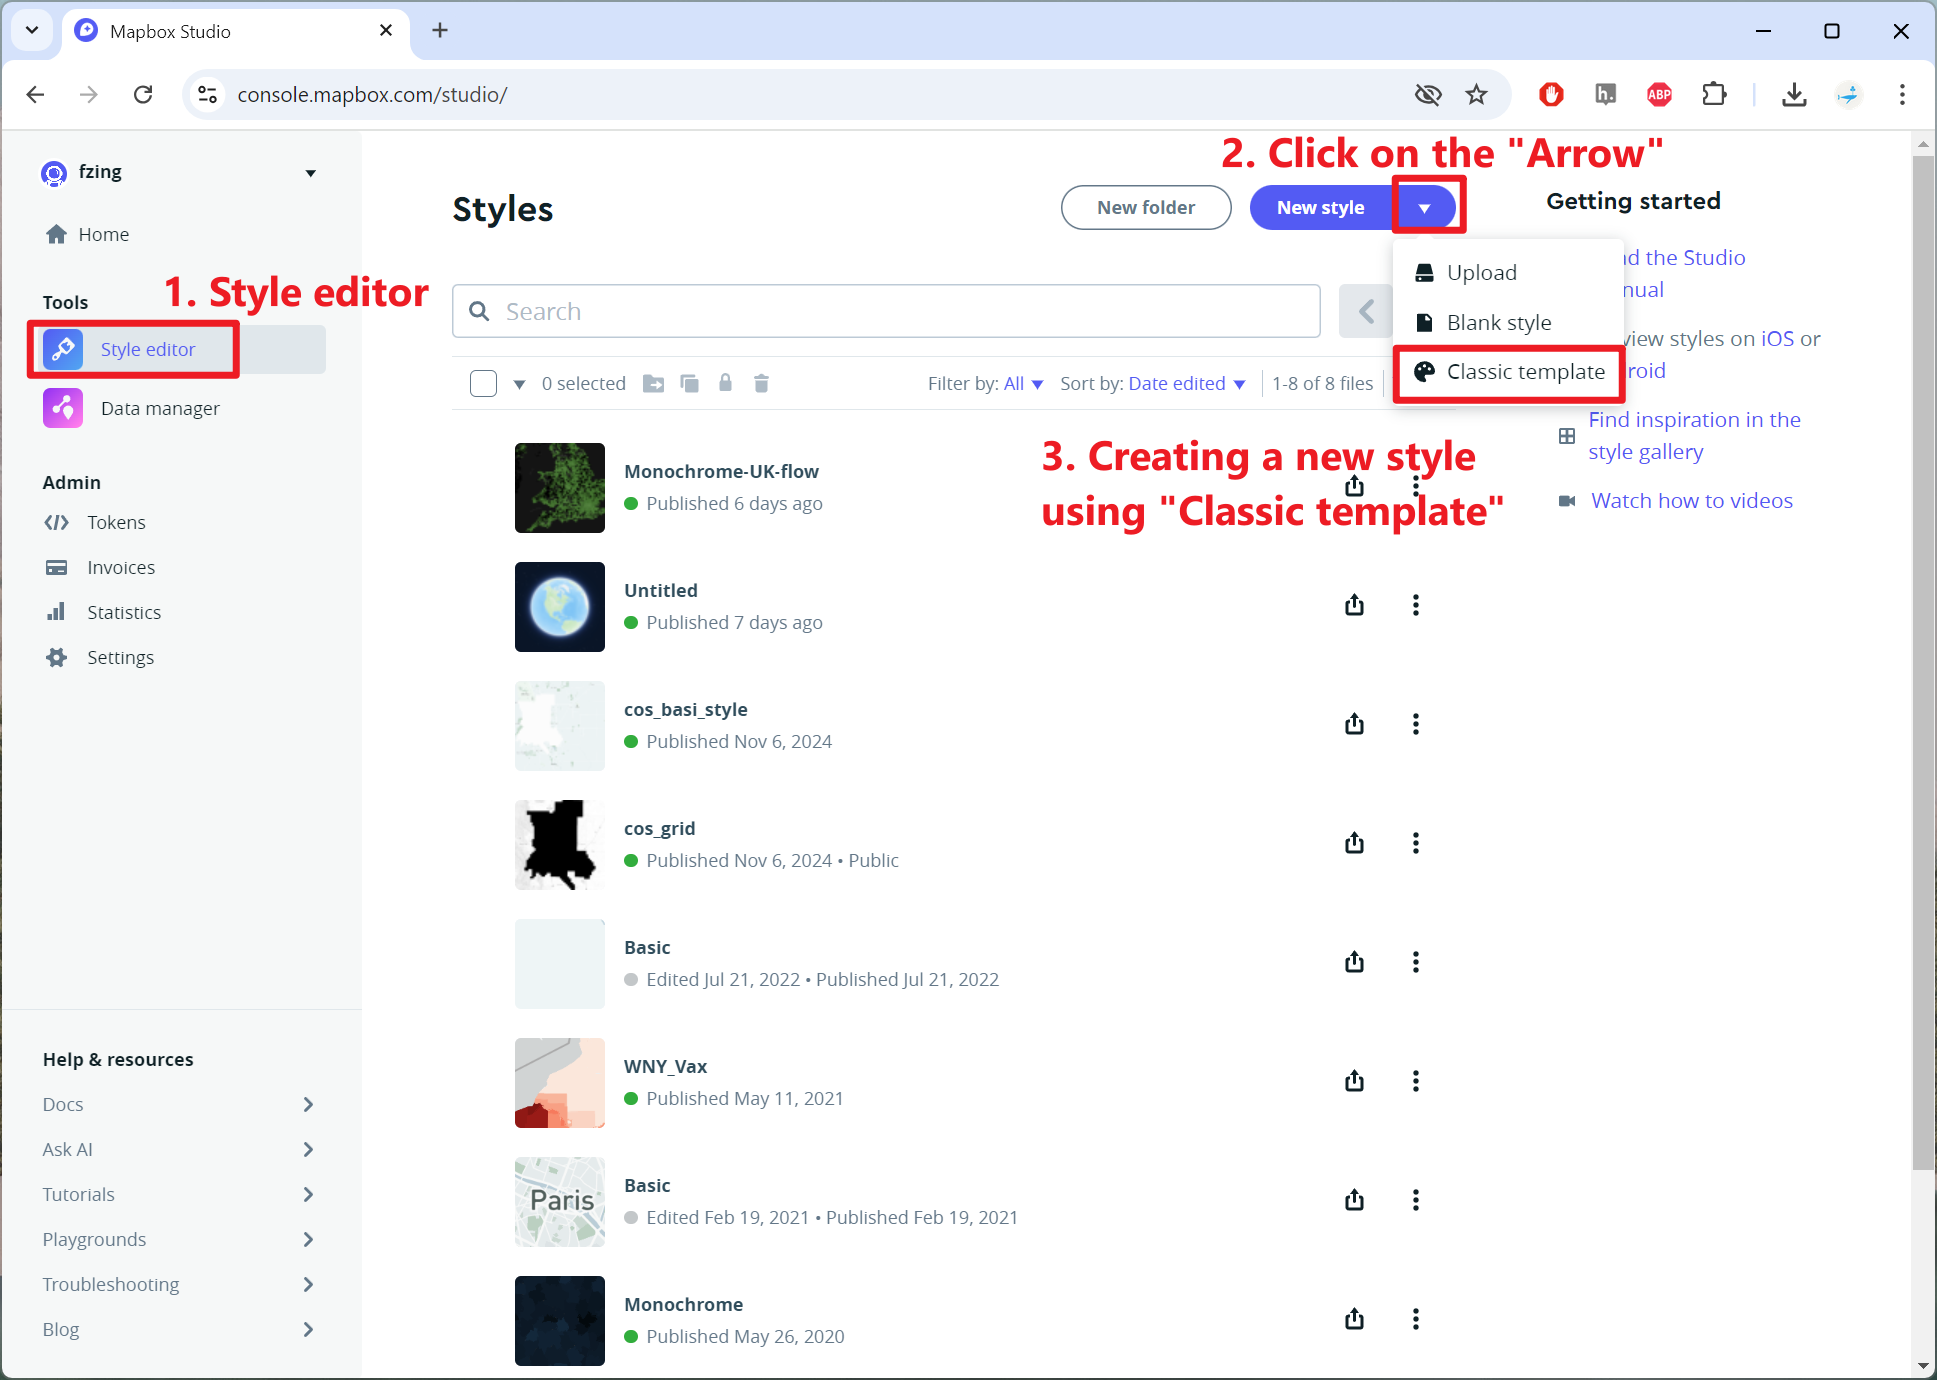
- Click on the Style Editor on the left panel. Then the arrow near New Style button to create a new style using Classic Template.
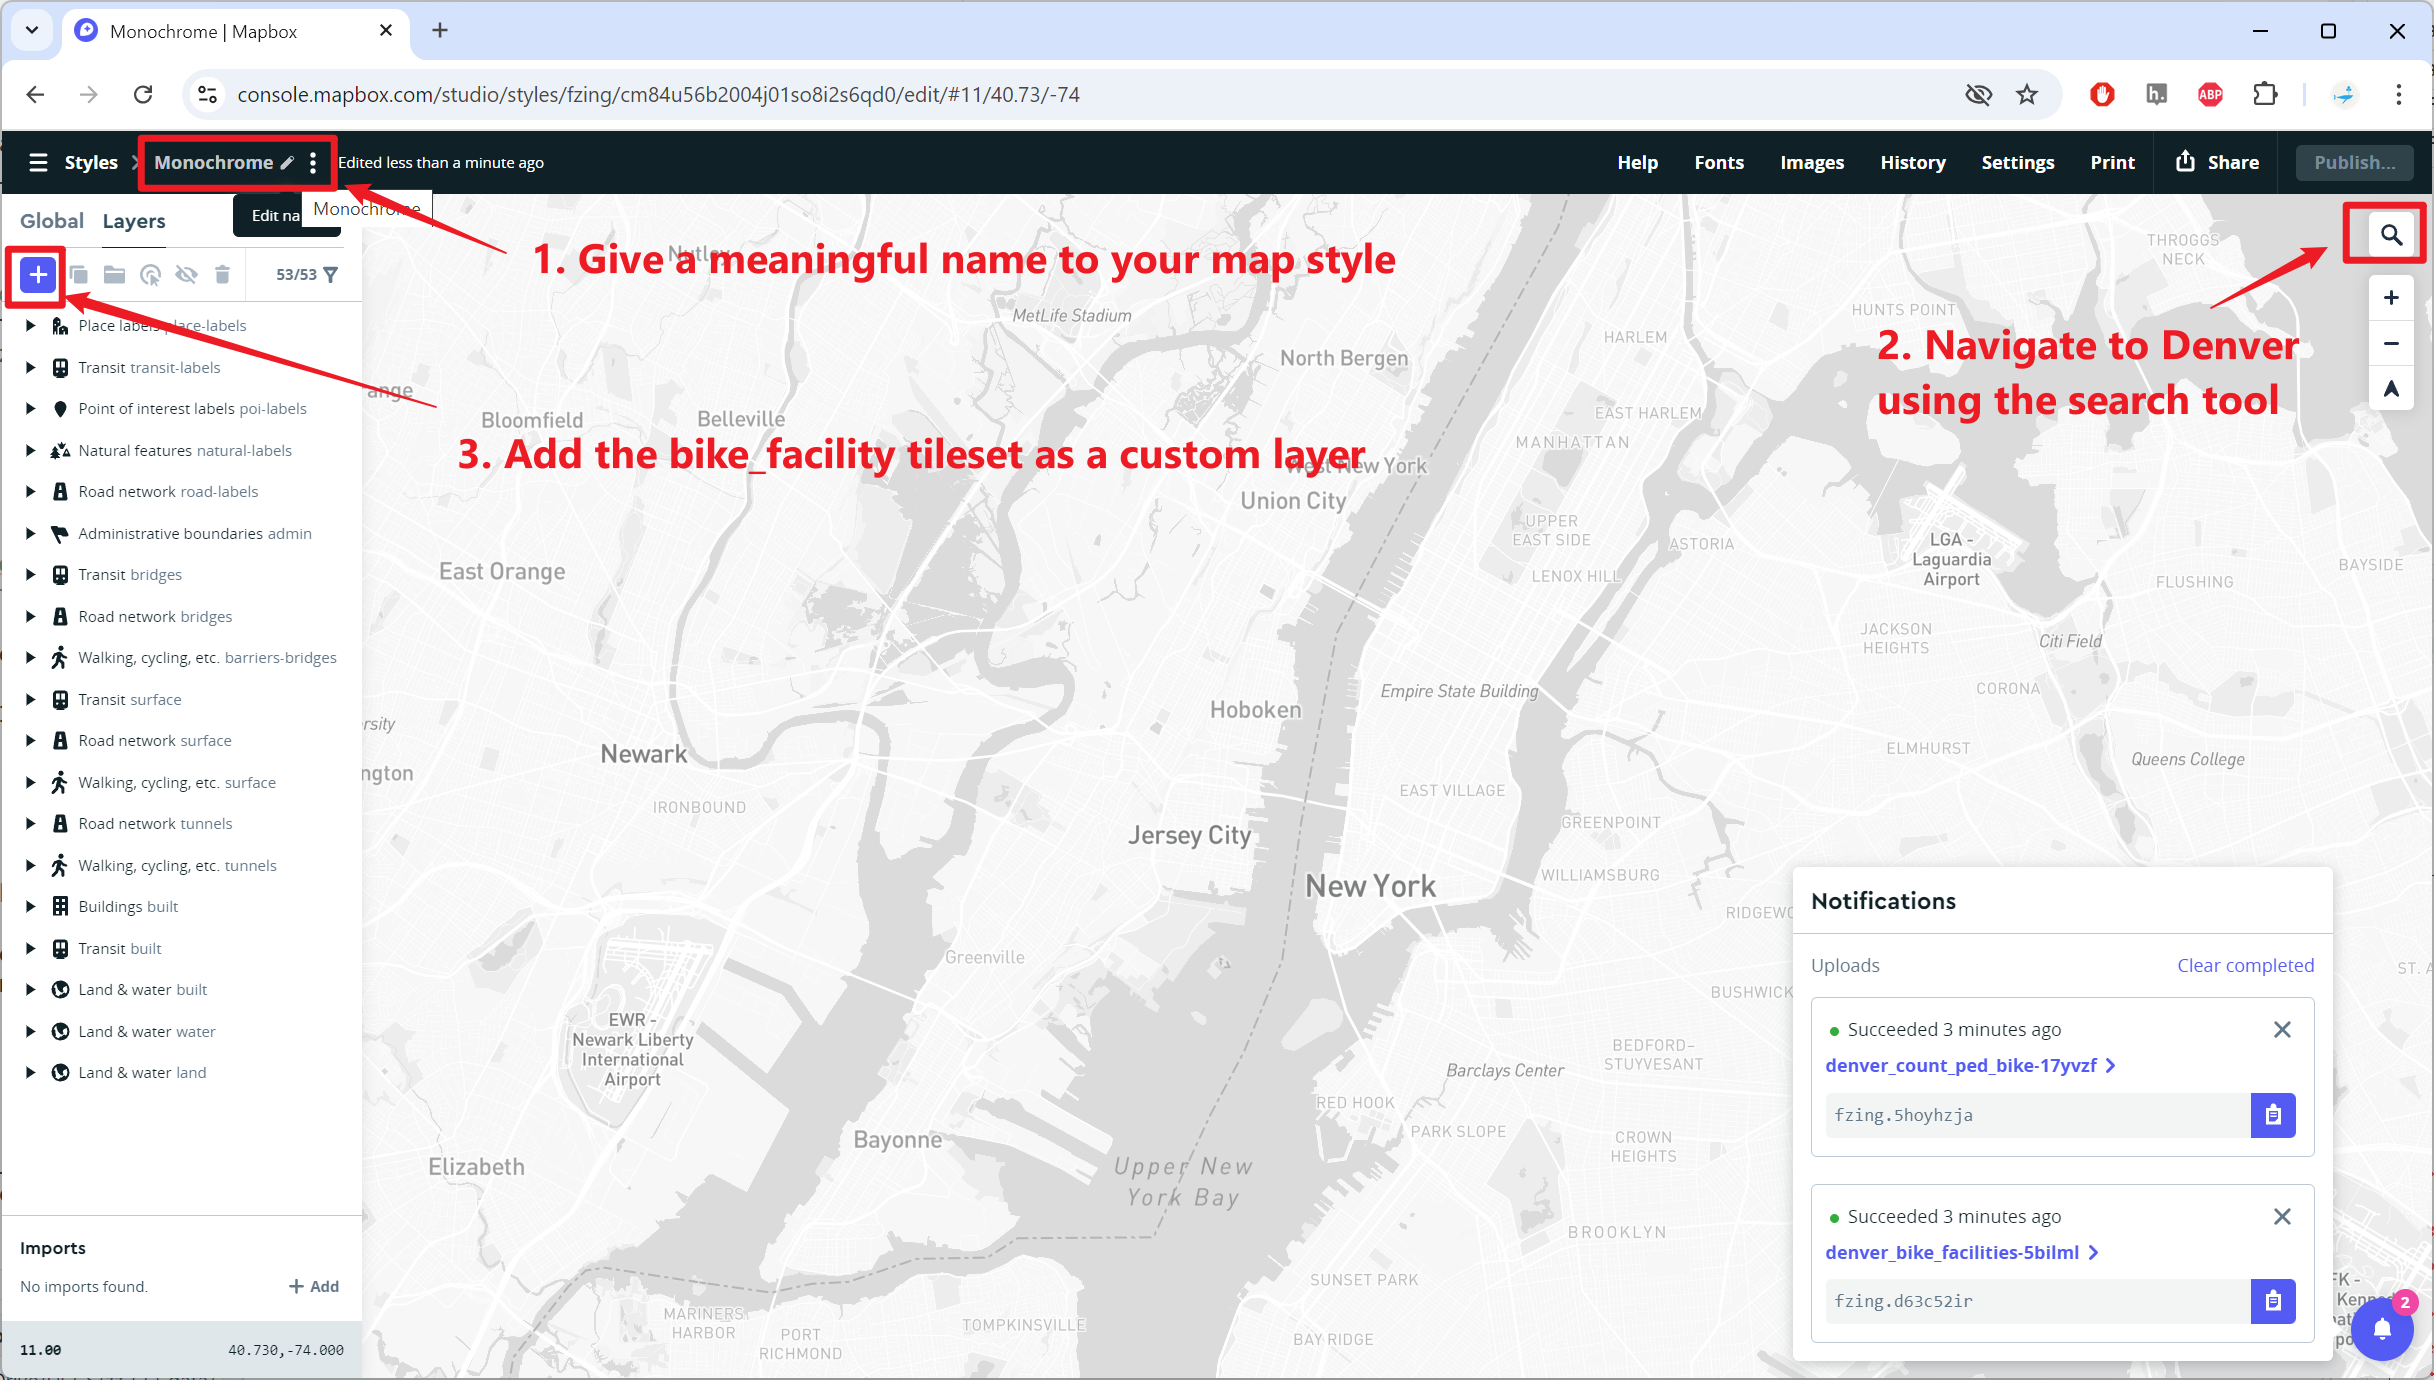
The Mapbox Studio interface gives you control over all the OpenStreetMap layers that make up the global Light background map. Let’s
- Give a meaningful name to the map style
- Navigate to the study area ‘Denver’
- Add the Denver Bike Facilities tileset
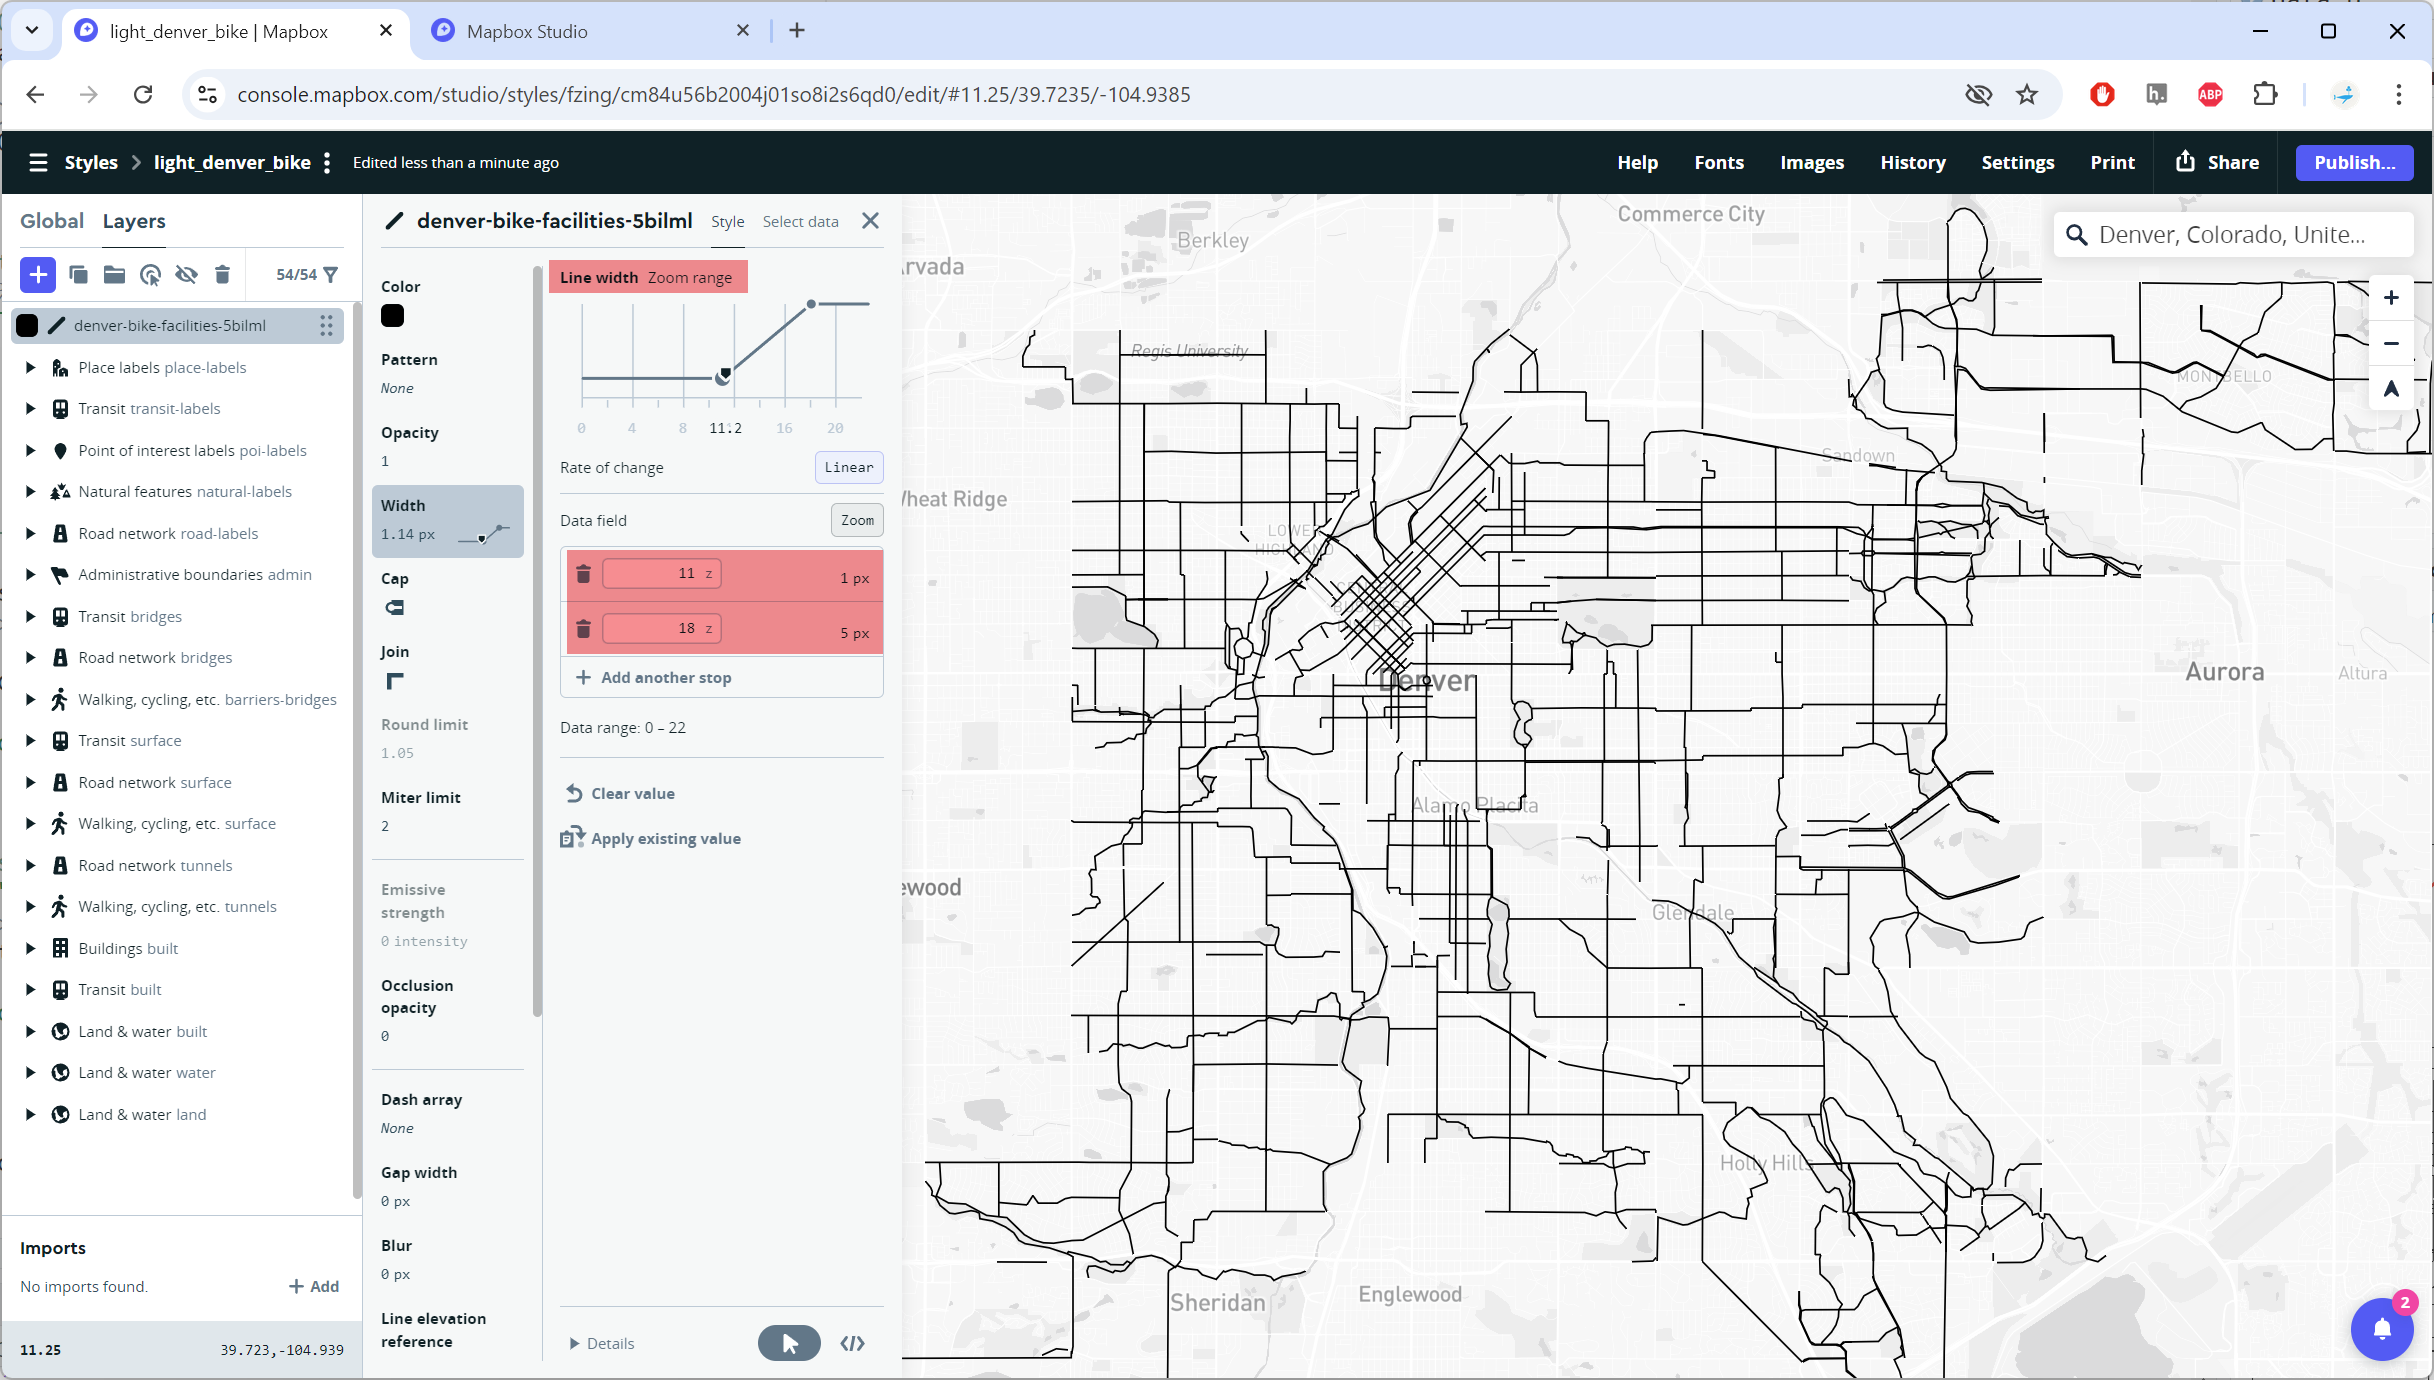
Next, we are going to style the Denver Bike Facilities layer and background data as you like for the map.
- One important option is the ability to adjust values according to the zoom level. Often we want features to become larger/wider as the user zooms in. So for example, the width of the Bike Facilities increases from 1px to 5px between zoom levels 11 and 18-
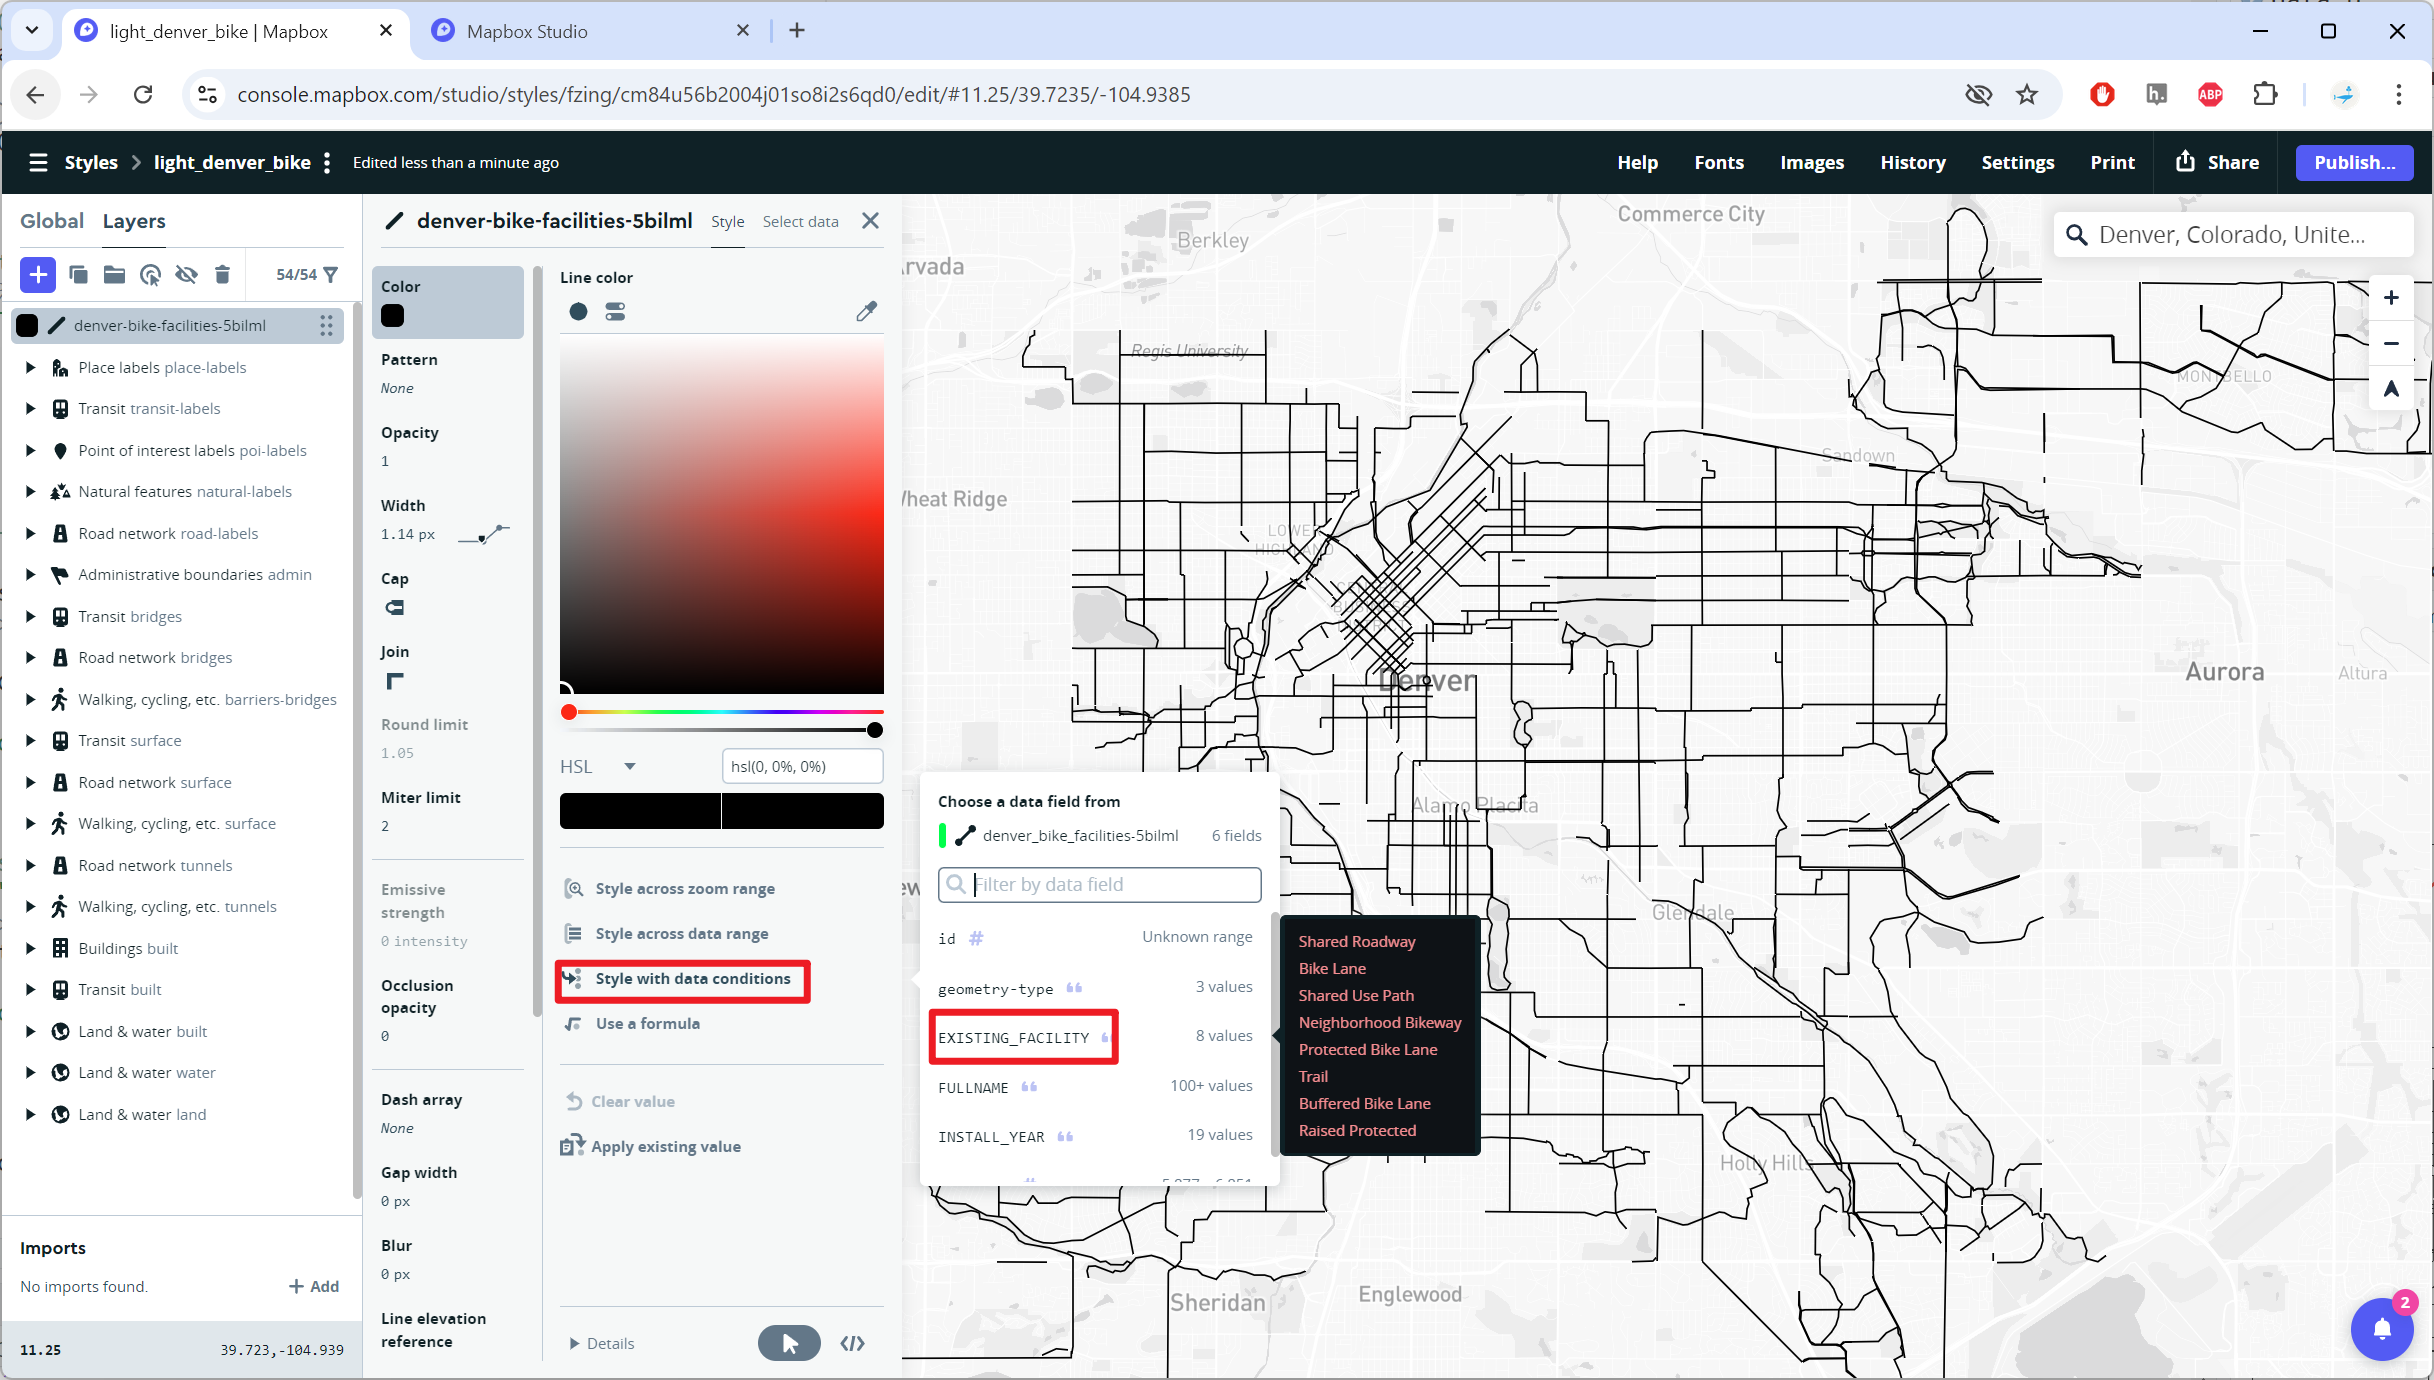
It’s possible to customize the Denver Bike Facilities layer by giving different colors to different types of bike facilities.
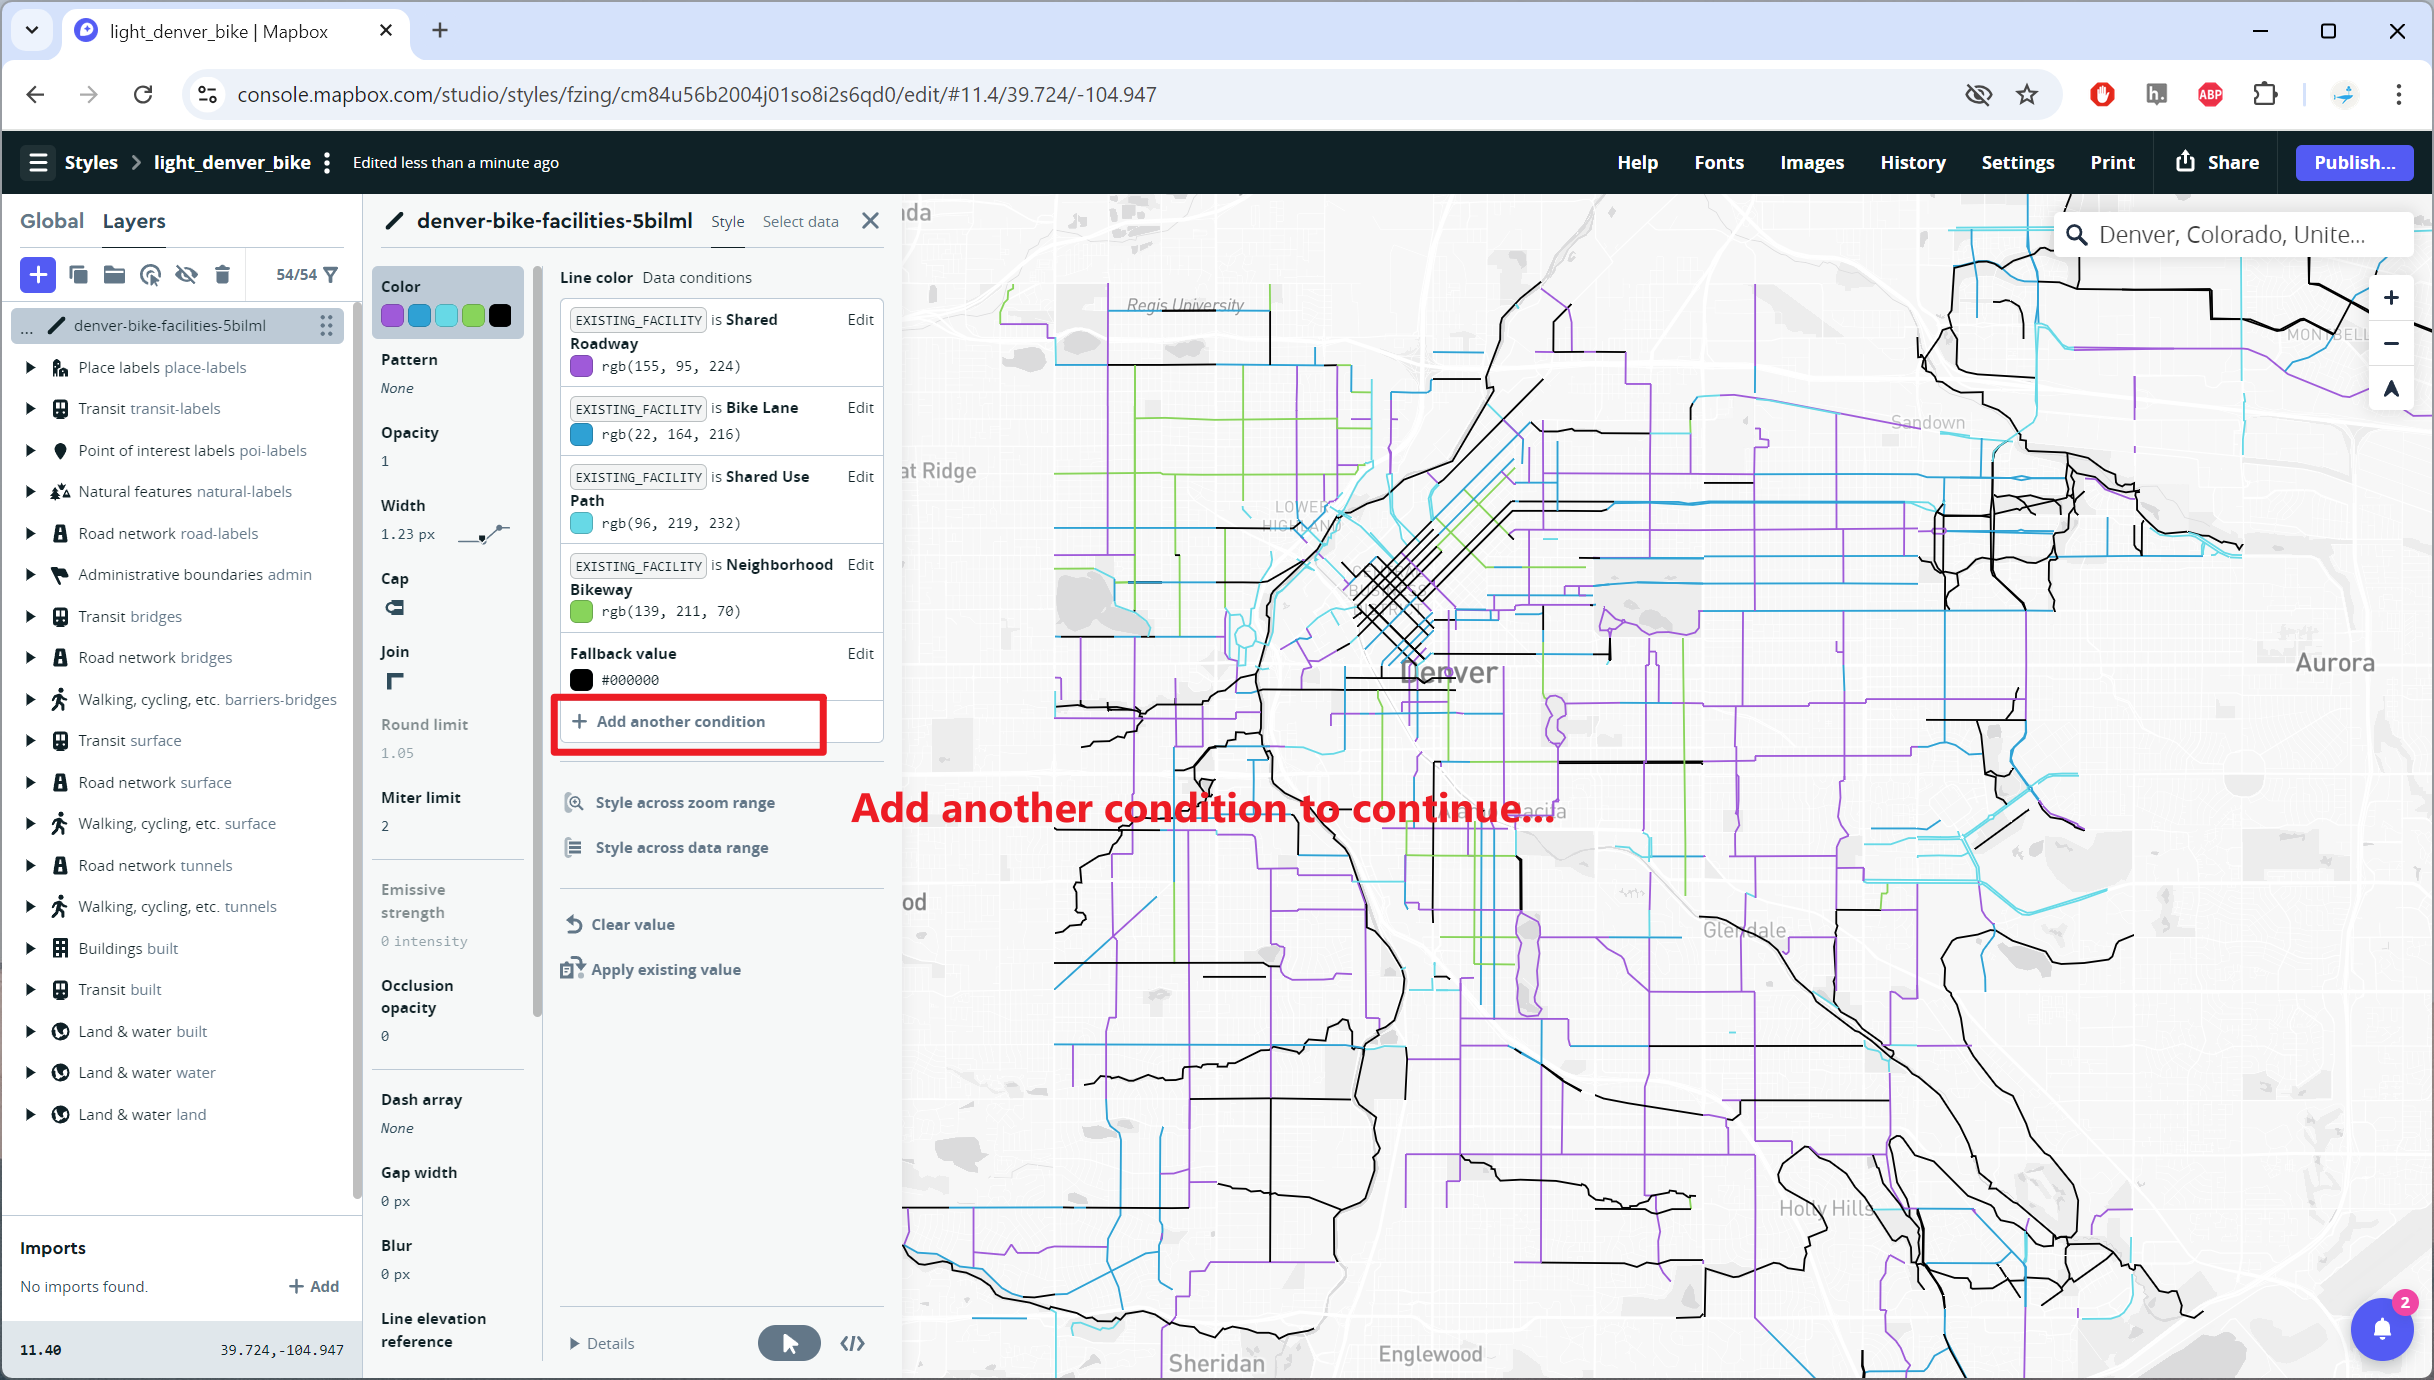
- Under the Color tab in the Denver Bike Facilities layer, choose style with data conditions using the variable EXISTING_FACILITY
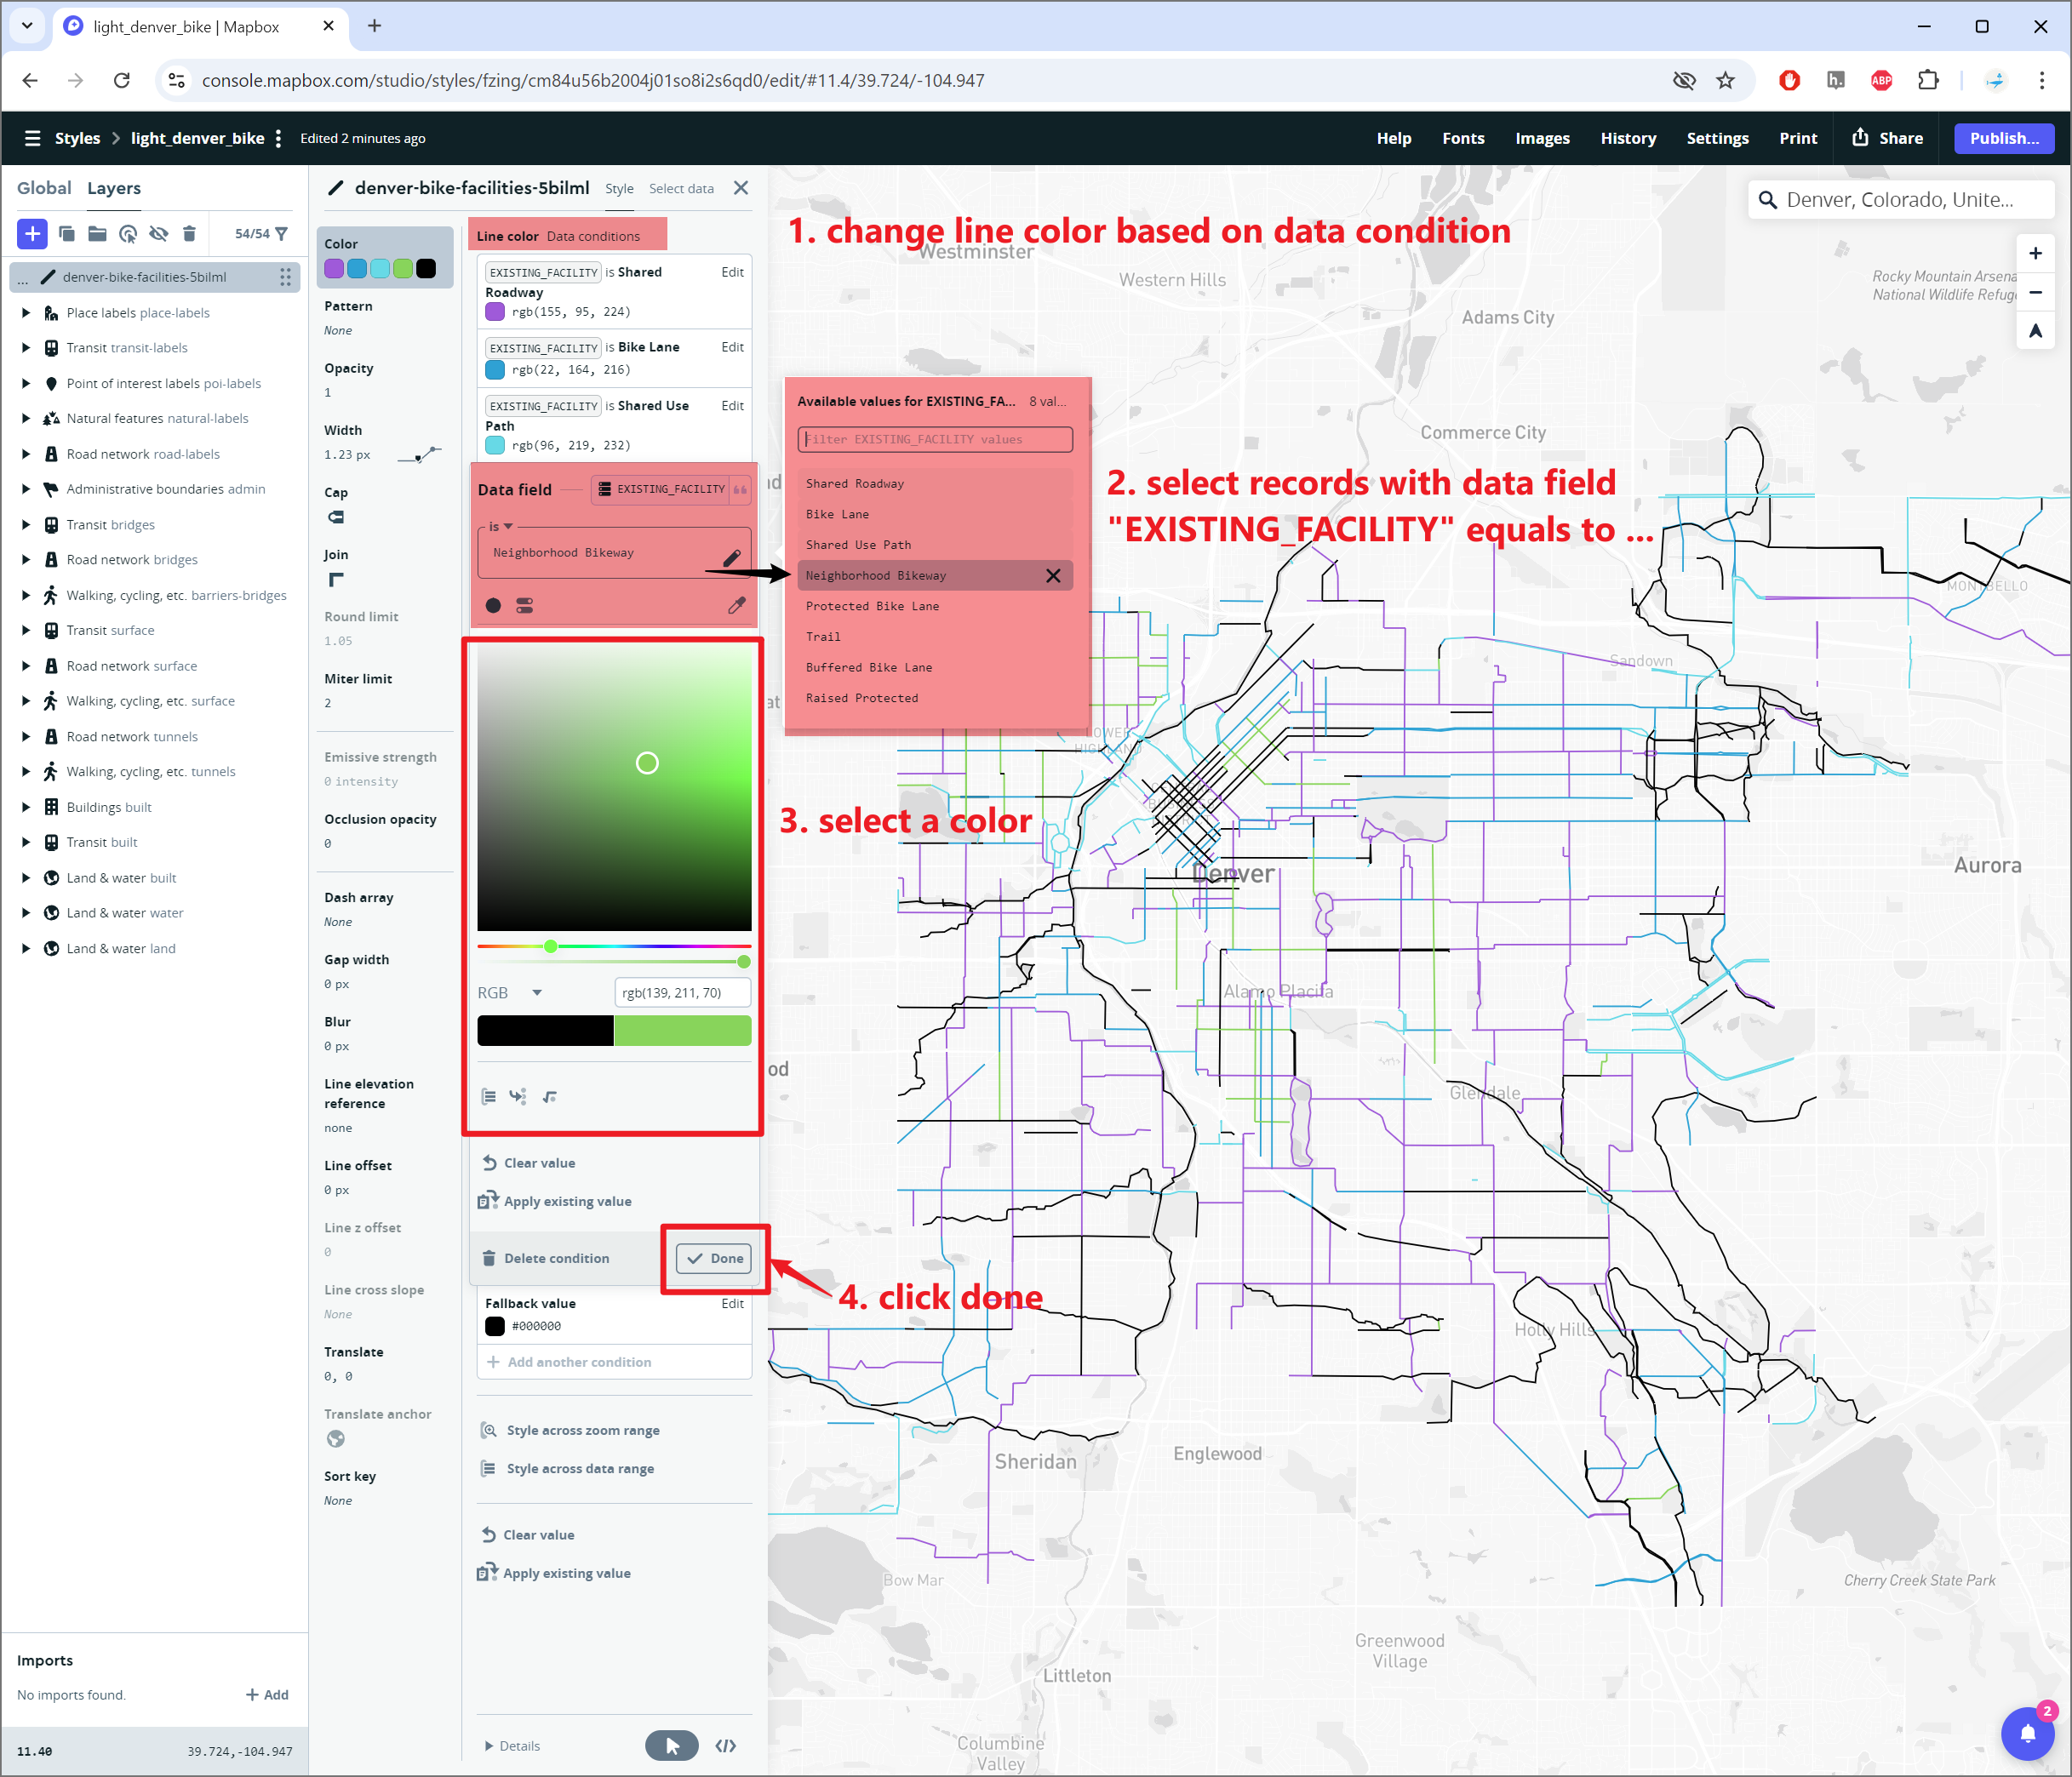
- Then, for records with data field “EXISTING_FACILITY” equals to CHOOSE AN AVALABLE VALUE, select a color and click DONE
- Then, add another condition to continue until covering all available values.
To customize base maps, you can also use the eye
symbol to hide layers (e.g., hide labels). 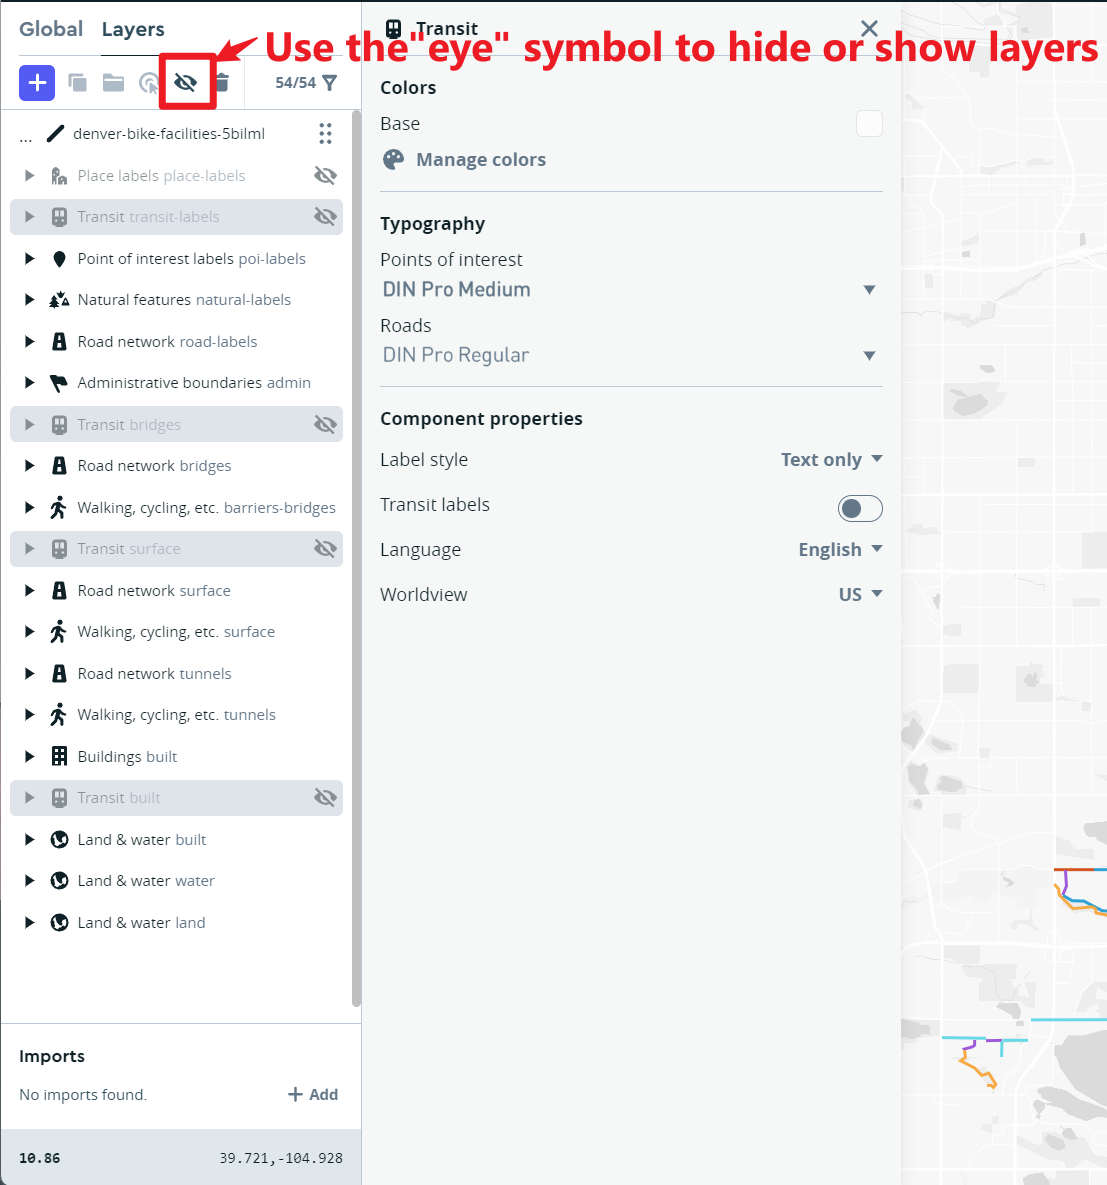
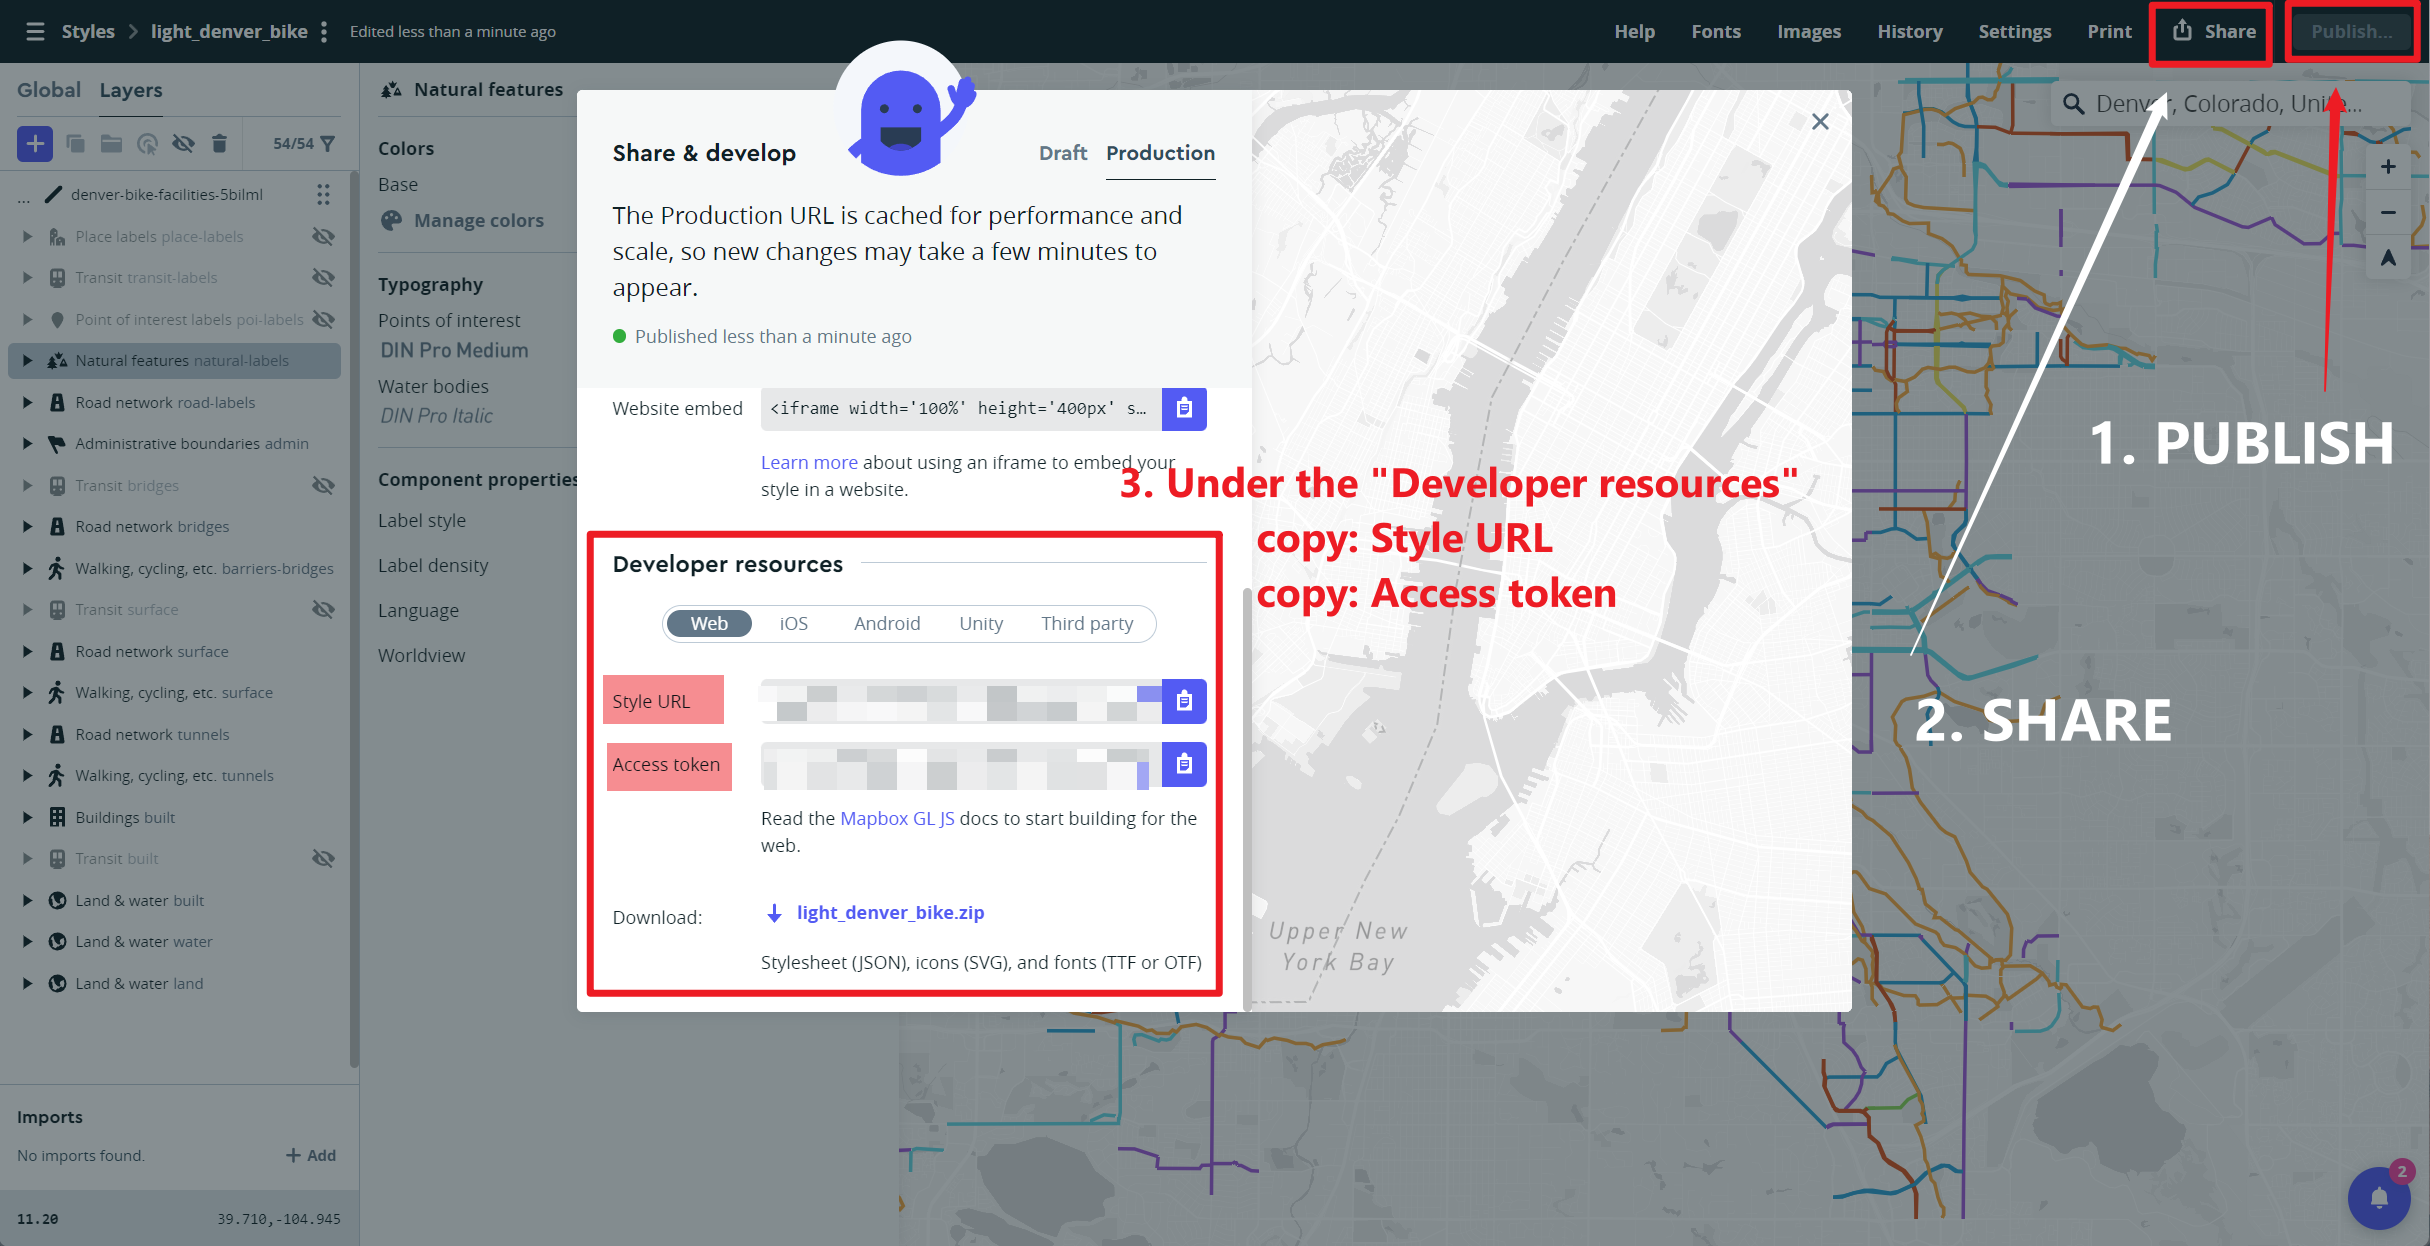
Finally, when you are happy with your map style, you can:
- press the Publish Your Style button at the top right of the page.
- Then press the Share button. This includes a Preview URL to view your style. It is better to use the Developer resources to use this map style on your own HTML page.
The full documentation for Mapbox Studio can be found here: https://www.mapbox.com/help/studio-manual/
Mapbox GL JavaScript Library
Mapbox GL JS is the main client-side JavaScript library for viewing maps created using Mapbox tools. A major difference with other mapping libraries is that it is based on WebGL, a more powerful graphics standard than standard HTML pages.
WebGL (Web Graphics Library) is a JavaScript API for rendering high-performance interactive 3D and 2D graphics within any compatible web browser without the use of plug-ins
This means that the library can handle more advanced graphics like animations and 3D data. Note you can rotate and tilt Mapbox GL maps by holding down your right mouse button and moving the mouse (this feature can also be turned off on your own maps).
Example 7
First of all, we will create a simple Mapbox.gl page that displays the background Bike Facilities map we created in Mapbox Studio. You will notice the code has many similarities to the Leaflet pages we created earlier-
Mapbox has a basic security system using access tokens. You will need to replace the mapboxgl.accessToken with your own token, and mapbox styleID with your base map ID. Please refer to screenshot above to obtain the two values.
<html>

<head>
<meta charset="utf-8" />
<title>Mapbox Example 7- Denver Bike Lanes</title>

<meta name="viewport" content="initial-scale=1,maximum-scale=1,user-scalable=no">
<link href="https://api.mapbox.com/mapbox-gl-js/v3.10.0/mapbox-gl.css" rel="stylesheet">
<script src="https://api.mapbox.com/mapbox-gl-js/v3.10.0/mapbox-gl.js"></script>

<style>
    body { margin: 0; padding: 0; }
    #map { position: absolute; top: 0; bottom: 0; width: 100%; };
</style>

</head>

<body>
<div id="map"></div>

<script>
    mapboxgl.accessToken = 'YOUR_MAPBOX_ACCESSTOKEN';  //Put your mapbox access token here

        // Load a new map in the 'map' HTML div
        var map = new mapboxgl.Map({
            container: 'map', // container id
            style: 'mapbox://styles/YOUR_MAPBOX_STYLE_URL', // Put your mapbox style URL here
            center: [-104.942114, 39.717785], // starting position [lng, lat]
            zoom: 11 // starting zoom
        });

</script>

</body>
</html>
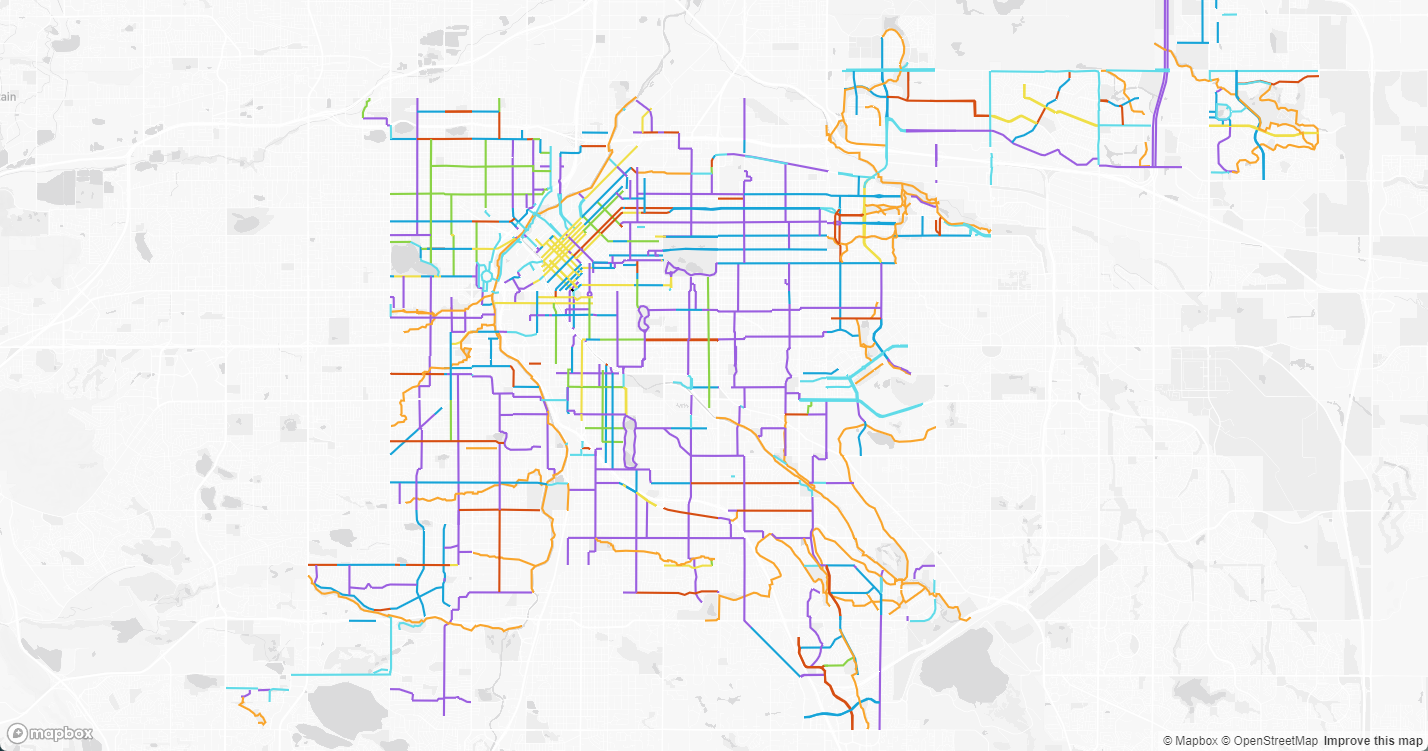
When you double click on the html file you have created, it should open in your default web browser software, and show a map as the image below.
Example 8
Next we are going to add the Counts of Pedestrian & Bicycle data as a new layer on top of our Bike Facility basemap. The Denver_count_ped_bike data is a Tileset, not a style, and we are going to style the data on the client-side in the JavaScript code. This gives us more flexibility to change the style interactively using JavaScript-
The new code is placed inside a function
map.on('load', function() { … });.
This is an example of an asynchronous JavaScript function- it is run
after the background map style has loaded. In this library we can only
add layers after the main map has been loaded on the page. We create a
new CIRCLE layer from the
Denver_count_ped_bike Tileset. This layer is a
proportional circle map, where the radius of the circle
depends on the count_ field from the original shapefile
(this field is count of pedestrian & bicycle from 2013 -
2023).
The
stopsproperty in Mapbox.gl creates a linear function between zoom levels, just like we used earlier in Mapbox Studio.
<html>

<head>
<meta charset="utf-8" />
<title>Mapbox Example 8- Proportional Circles</title>

<meta name="viewport" content="initial-scale=1,maximum-scale=1,user-scalable=no">
<link href="https://api.mapbox.com/mapbox-gl-js/v3.10.0/mapbox-gl.css" rel="stylesheet">
<script src="https://api.mapbox.com/mapbox-gl-js/v3.10.0/mapbox-gl.js"></script>

<style>
    body { margin: 0; padding: 0; }
    #map { position: absolute; top: 0; bottom: 0; width: 100%; };
</style>

</head>

<body>
<div id="map"></div>

<script>

    mapboxgl.accessToken = 'YOUR_MAPBOX_ACCESSTOKEN';  //Put your mapbox access token here

        // Load a new map in the 'map' HTML div
        var map = new mapboxgl.Map({
            container: 'map', // container id
            style: 'mapbox://styles/YOUR_MAPBOX_STYLE_URL', // Put your mapbox style URL here
            center: [-104.942114, 39.717785], // starting position [lng, lat]
            zoom: 11 // starting zoom
        });


        map.on('load', function() {

            // Add a CIRCLE layer to the map
            map.addLayer({
                'id':'denver_count_ped_bike',
                'type':'circle',
                'source':{
                    type:'vector',
                    url:'mapbox://YOUR_TILESET_ID' // Your Mapbox tileset Map ID
                },
                'source-layer':'YOUR_TILESET_NAME', // name of tilesets
                'layout':{
                    'visibility': 'visible'
                },
                'paint': {
                    'circle-color':'#fffef7',
                    'circle-opacity':0.2,
                    'circle-stroke-width':{
                        stops: [[8,0.5], [100,5], [500,10]]
                    },
                    'circle-stroke-color':'#000',          //points on the graph
                    'circle-stroke-opacity':0.5,
                    'circle-radius':{
                        property:'count_',
                        stops:[
                            [{zoom:9, value:0}, 3],
                            [{zoom:9, value:4100}, 10],
                            [{zoom:12, value:0}, 4],
                            [{zoom:12, value:4100}, 80],
                            [{zoom:16, value:0}, 6],
                            [{zoom:16, value:4100}, 150],
                        ]                                 //setting up proportional circle
                    }
                }
            });


        })


</script>

</body>
</html>
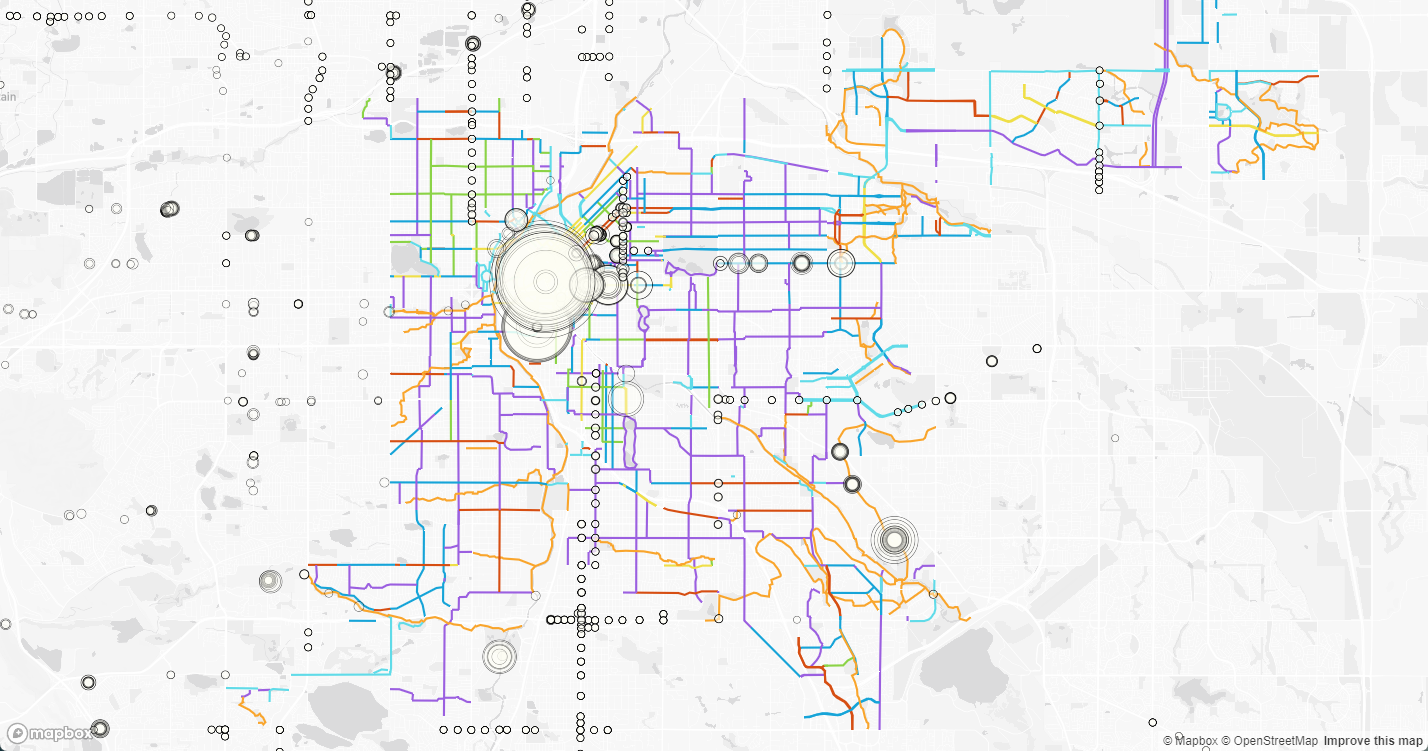
When you double click on the html file you have created, it should open in your default web browser software, and show a map as the image below.
Example 9
Next, we are going to add another LABEL layer from the Denver_count_ped_bike Tileset. This labels the number of bicycle & pedestrian counts at different times during 2013 - 2023. The same variable as is used for the circle sizes. Your map should appear similar to the map below-
<html>

<head>
<meta charset="utf-8" />
<title>Mapbox Example 9 - Label</title>

<meta name="viewport" content="initial-scale=1,maximum-scale=1,user-scalable=no">
<link href="https://api.mapbox.com/mapbox-gl-js/v3.10.0/mapbox-gl.css" rel="stylesheet">
<script src="https://api.mapbox.com/mapbox-gl-js/v3.10.0/mapbox-gl.js"></script>

<style>
    body { margin: 0; padding: 0; }
    #map { position: absolute; top: 0; bottom: 0; width: 100%; };
</style>

</head>

<body>
<div id="map"></div>

<script>

    mapboxgl.accessToken = 'YOUR_MAPBOX_ACCESSTOKEN';  //Put your mapbox access token here

        // Load a new map in the 'map' HTML div
        var map = new mapboxgl.Map({
            container: 'map', // container id
            style: 'mapbox://styles/YOUR_MAPBOX_STYLE_URL', // Put your mapbox style URL here
            center: [-104.942114, 39.717785], // starting position [lng, lat]
            zoom: 11 // starting zoom
        });


        map.on('load', function() {

            // Add a CIRCLE layer to the map
            map.addLayer({
                'id':'denver_count_ped_bike',
                'type':'circle',
                'source':{
                    type:'vector',
                    url:'mapbox://YOUR_TILESET_ID' // Your Mapbox tileset Map ID
                },
                'source-layer':'YOUR_TILESET_NAME', // name of tilesets
                'layout':{
                    'visibility': 'visible'
                },
                'paint': {
                    'circle-color':'#fffef7',
                    'circle-opacity':0.2,
                    'circle-stroke-width':{
                        stops: [[8,0.5], [100,5], [500,10]]
                    },
                    'circle-stroke-color':'#000',          //points on the graph
                    'circle-stroke-opacity':0.5,
                    'circle-radius':{
                        property:'count_',
                        stops:[
                            [{zoom:9, value:0}, 3],
                            [{zoom:9, value:4100}, 10],
                            [{zoom:12, value:0}, 4],
                            [{zoom:12, value:4100}, 80],
                            [{zoom:16, value:0}, 6],
                            [{zoom:16, value:4100}, 150],
                        ]                                 //setting up proportional circle
                    }
                }
            });

            // Add a LABEL layer to the map
            map.addLayer({
                'id':'denver_count_ped_bike_label',
                'type':'symbol',
                'source':'denver_count_ped_bike',
                'source-layer':'YOUR_TILESET_NAME',  // name of tilesets
                'layout':{
                    'text-field':'{count_}',
                    'text-size':{
                        stops:[[0, 0.5],[100, 70],[500,300]]
                    }
                },
                'paint':{
                    'text-color':'black'
                }

            })

        })


</script>

</body>
</html>
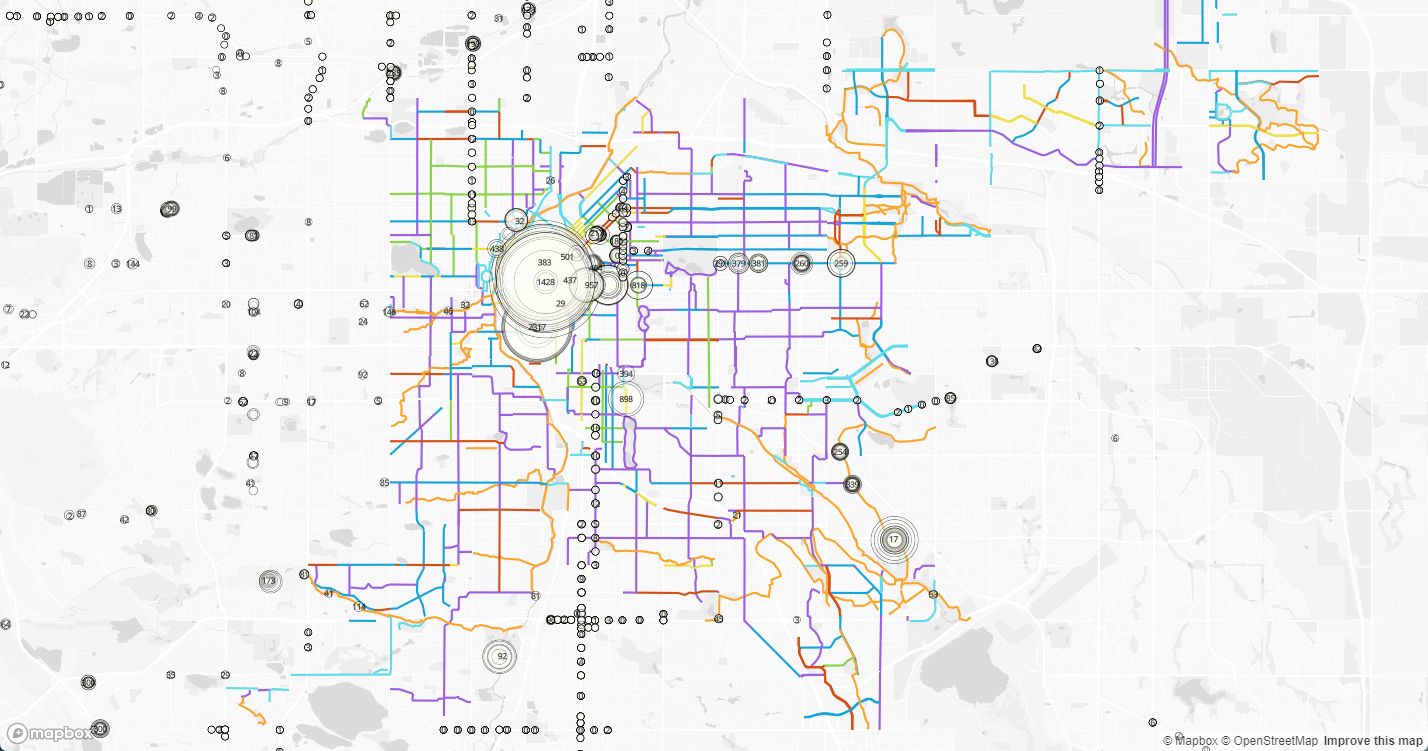
When you double click on the html file you have created, it should open in your default web browser software, and show a map as the image below.
Adding User Interaction and Dynamic Styling to Mapbox
The advantage of styling data using JavaScript on the client-side, rather than preparing our styles in advance in Mapbox Studio, is that we can change the styling dynamically in response to user interaction.
Our next example, which is rather longer, creates an interactive time-slider.
- When the user moves the time-slider it triggers a function which changes which variable (column in the data table) the denver_count_ped_bike layers are displaying, so that the user can change the data year that is shown on the map.
- This is an event-based structure, which is typical for JavaScript.
This example 10 adds several features to our page:
- a link to an external stylesheet Mapbox_example10_styles.css that controls the appearance of the time-slider, the text around the time-slider and the popup (in Example 11).
- a div element
map-overlaywithin which the map title and time-slider are placed. - an array variable
yearsthat lists the data years used on the time-slider. - function
setYear()which is called when the user changes the time-slider. This functionsetFilter()on the denver_count_ped_bike layer, and redraws these layers according to the data year that the user has selected. - a filter for the labels layer according to the data
year that the user has selected.
- an
event listenerfor the time-slider feature that triggers the functionsetYearevery time the time-slider is moved by the user.
Example 10
<html>

<head>
<meta charset="utf-8" />
<title>Mapbox Example 10- Timeslider</title>

<meta name="viewport" content="initial-scale=1,maximum-scale=1,user-scalable=no">
<link href="https://api.mapbox.com/mapbox-gl-js/v3.10.0/mapbox-gl.css" rel="stylesheet">
<script src="https://api.mapbox.com/mapbox-gl-js/v3.10.0/mapbox-gl.js"></script>

<!-- Importing style from a local file -->
<link href = 'Mapbox_example10_styles.css' rel = 'stylesheet' />


</head>

<body>
<div id="map"></div>

<div class='map-overlay'>
    <div class='map-overlay-inner'>
        <h2> Denver Pedestrian & Bicycle Counts</h2>
        <table>
            <tr> <td>
                <input id="year_slider" type='range' min='0' max='10' step='1' value='0' list='tickmarks' />
                <datalist id="tickmarks">
                    <option value="0" label="2013">
                    <option value="1" >
                    <option value="2" >
                    <option value="3" >
                    <option value="4" >
                    <option value="5" label="2018">
                    <option value="6" >
                    <option value="7" >
                    <option value="8" >
                    <option value="9" >
                    <option value="10" label="2023">
                </datalist>
            </td>

            <td>
                <label id='year'> 2013</label>
            </td>
        </tr>
        </table>

        <p class="credit"> This map is created for <a href="https://fuzhen-yin.github.io/uccs_cartography/index.html"> GES Cartography Lab </a> by using the <a href="https://data.drcog.org/dataset/bicycle-and-pedestrian-counts"> Pedestrian & Bicycle Count Data</a> and <a href='https://opendata-geospatialdenver.hub.arcgis.com/datasets/f651766e877249108933f9f9f3196b69_244/explore?location=39.737255%2C-104.887634%2C9.99'>Existing Bike Facilities Data</a>  </p>

    </div>
</div>


<script>

    mapboxgl.accessToken = 'YOUR_MAPBOX_ACCESSTOKEN';  //Put your mapbox access token here

        // Load a new map in the 'map' HTML div
        var map = new mapboxgl.Map({
            container: 'map', // container id
            style: 'mapbox://styles/YOUR_MAPBOX_STYLE_URL', // Put your mapbox style ID here
            center: [-104.942114, 39.717785], // starting position [lng, lat]
            zoom: 11 // starting zoom
        });

        // Create an array of the available data years
        var years = [
            '2013',
            '2014',
            '2015',
            '2016',
            '2017',
            '2018',
            '2019',
            '2020',
            '2021',
            '2022',
            '2023'
        ];               //Use this array to change the column item in our map


        map.on('load', function() {

            // This is the main function that runs when the user changes the value of year
            function setYear(year){

                // Set the label to the correct year
                document.getElementById('year').textContent = years[year];
                var year_f = String(years[year]);

                var data_year_filter = ['==', 'year', year_f];

                map.setFilter('denver_count_ped_bike', data_year_filter)
                map.setFilter('denver_count_ped_bike_label', data_year_filter)

                console.log(year_f)
            }

            // Add a CIRCLE layer to the map
            map.addLayer({
                'id':'denver_count_ped_bike',
                'type':'circle',
                'source':{
                    type:'vector',
                    url:'mapbox://YOUR_TILESET_ID' // Your Mapbox tileset Map ID
                },
                'source-layer':'YOUR_TILESET_NAME', // name of tilesets
                'layout':{
                    'visibility': 'visible'
                },
                // filter: ['==', 'year', year_v],
                'paint': {
                    'circle-color':'#c7e9c0',
                    'circle-opacity':0.2,
                    'circle-stroke-width':{
                        stops: [[8,0.5], [100,5], [500,10]]
                    },
                    'circle-stroke-color':'#000',          //points on the graph
                    'circle-stroke-opacity':0.5,
                    'circle-radius':{
                        property:'count_',
                        stops:[
                            [{zoom:9, value:0}, 10],
                            [{zoom:9, value:4100}, 20],
                            [{zoom:12, value:0}, 4],
                            [{zoom:12, value:4100}, 100],
                            [{zoom:16, value:0}, 6],
                            [{zoom:16, value:4100}, 300],
                        ]                                 //setting up proportional circle
                    }
                }
            });

            // Add a LABEL layer to the map
            map.addLayer({
                'id':'denver_count_ped_bike_label',
                'type':'symbol',
                'source':'denver_count_ped_bike',
                'source-layer':'YOUR_TILESET_NAME',  // name of tilesets
                // filter: ['==', 'year', year_v],
                'layout':{
                    'text-field':'{count_}',
                    'text-size':{
                        stops:[[0, 1],[100, 100],[500,400]]
                    }
                },
                'paint':{
                    'text-color':'black'
                }
            })

            // Default filter to map the initial slide value = 0
            var data_year_filter = ['==', 'year', '2013'];
            map.setFilter('denver_count_ped_bike', data_year_filter);
            map.setFilter('denver_count_ped_bike_label', data_year_filter);

            // Create an event listener to the slider so that the "setYear()" function runs when the user changes the slider
            document.getElementById('year_slider').addEventListener('input', function(e){
                var year = parseInt(e.target.value);
                setYear(year);
            });

        })


</script>

</body>
</html>
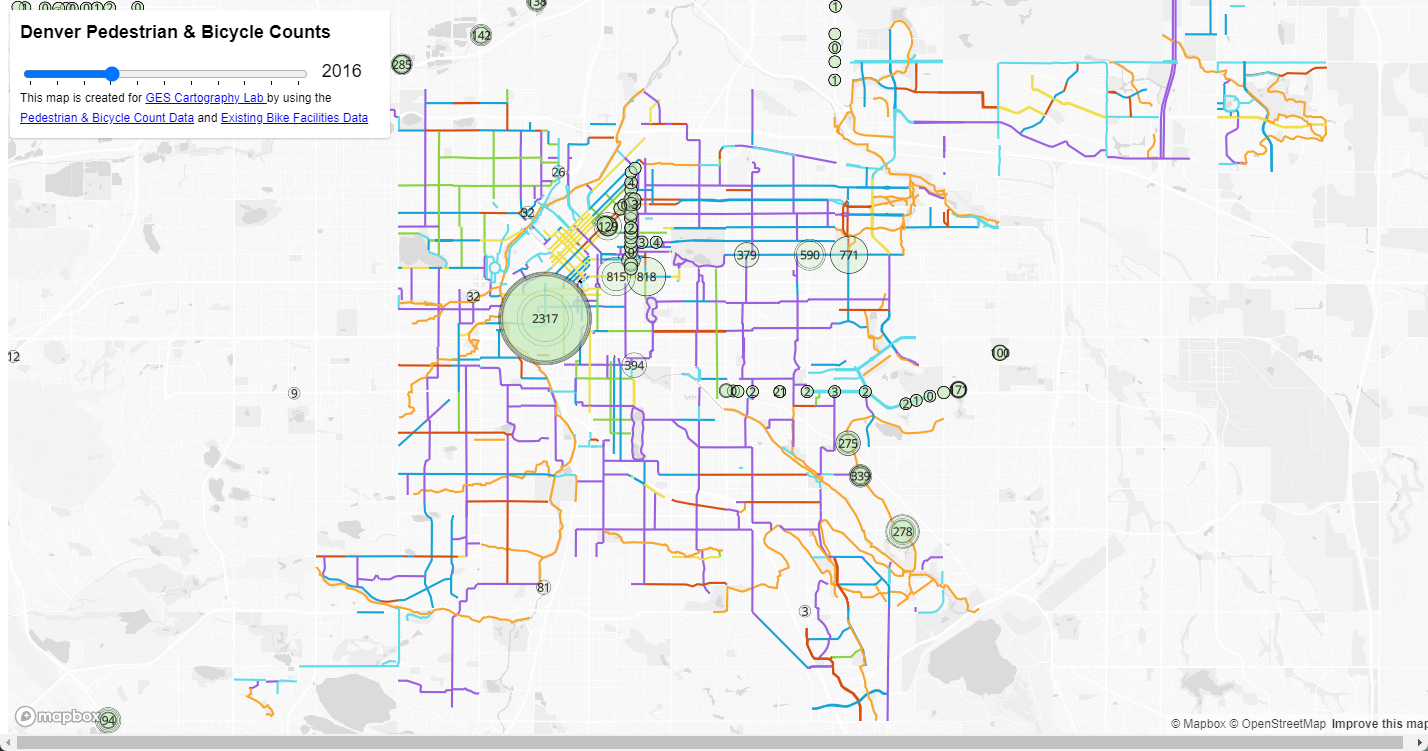
When you double click on the html file you have created, it should open in your default web browser software, and show a map as the image below.
Example 11
Here, we are adding more interactive features.
When a user event occurs (click on something, mouse-over something) a function is triggered which changes the page.
- a variable that creates a new Mapbox popup object.
- a
mouseoverfunction that is triggered when the user puts their pointer over a Pedestrain Count Data Point. The popup then becomes visible. - a
mouseenterand amouseexitfunction that changes the mouse pointer when hovering over a tube station, and removes the popup when moving the mouse off a tube station.
<html>

<head>
<meta charset="utf-8" />
<title>Mapbox Example 11- Mouse On PopUp</title>

<meta name="viewport" content="initial-scale=1,maximum-scale=1,user-scalable=no">
<link href="https://api.mapbox.com/mapbox-gl-js/v3.10.0/mapbox-gl.css" rel="stylesheet">
<script src="https://api.mapbox.com/mapbox-gl-js/v3.10.0/mapbox-gl.js"></script>

<!-- Importing style from a local file -->
<link href = 'Mapbox_example10_styles.css' rel = 'stylesheet' />


</head>

<body>
<div id="map"></div>

<div class='map-overlay'>
    <div class='map-overlay-inner'>
        <h2> Denver Pedestrian & Bicycle Counts</h2>
        <table>
            <tr> <td>
                <input id="year_slider" type='range' min='0', max='10' step='1' value='0' list='tickmarks' />
                <datalist id="tickmarks">
                    <option value="0" label="2013">
                    <option value="1" >
                    <option value="2" >
                    <option value="3" >
                    <option value="4" >
                    <option value="5" label="2018">
                    <option value="6" >
                    <option value="7" >
                    <option value="8" >
                    <option value="9" >
                    <option value="10" label="2023">
                </datalist>
            </td>

            <td>
                <label id='year'> 2013</label>
            </td>
        </tr>
        </table>

        <p class="credit"> This map is created for <a href="https://fuzhen-yin.github.io/uccs_cartography/index.html"> GES Cartography Lab </a> by using the <a href="https://data.drcog.org/dataset/bicycle-and-pedestrian-counts"> Pedestrian & Bicycle Count Data</a> and <a href='https://opendata-geospatialdenver.hub.arcgis.com/datasets/f651766e877249108933f9f9f3196b69_244/explore?location=39.737255%2C-104.887634%2C9.99'>Existing Bike Facilities Data</a>  </p>

    </div>
</div>


<script>

    mapboxgl.accessToken = 'YOUR_MAPBOX_ACCESSTOKEN';  //Put your mapbox access token here

        // Load a new map in the 'map' HTML div
        var map = new mapboxgl.Map({
            container: 'map', // container id
            style: 'mapbox://styles/YOUR_MAPBOX_STYLE_URL', // Put your mapbox style URL here
            center: [-104.942114, 39.717785], // starting position [lng, lat]
            zoom: 11 // starting zoom
        });

        // Create an array of the available data years
        var years = [
            '2013',
            '2014',
            '2015',
            '2016',
            '2017',
            '2018',
            '2019',
            '2020',
            '2021',
            '2022',
            '2023'
        ];               //Use this array to change the column item in our map


        map.on('load', function() {

            // This is the main function that runs when the user changes the value of year
            function setYear(year){

                // Set the label to the correct year
                document.getElementById('year').textContent = years[year];
                var year_f = String(years[year]);

                var data_year_filter = ['==', 'year', year_f];

                map.setFilter('denver_count_ped_bike', data_year_filter)
                map.setFilter('denver_count_ped_bike_label', data_year_filter)

                console.log(year_f)
            }

            // Add a CIRCLE layer to the map
            map.addLayer({
                'id':'denver_count_ped_bike',
                'type':'circle',
                'source':{
                    type:'vector',
                    url:'mapbox://YOUR_TILESET_ID' // Your Mapbox tileset Map ID
                },
                'source-layer':'YOUR_TILESET_NAME', // name of tilesets
                'layout':{
                    'visibility': 'visible'
                },
                // filter: ['==', 'year', year_v],
                'paint': {
                    'circle-color':'#c7e9c0',
                    'circle-opacity':0.2,
                    'circle-stroke-width':{
                        stops: [[8,0.5], [100,5], [500,10]]
                    },
                    'circle-stroke-color':'#000',          //points on the graph
                    'circle-stroke-opacity':0.5,
                    'circle-radius':{
                        property:'count_',
                        stops:[
                            [{zoom:9, value:0}, 10],
                            [{zoom:9, value:4100}, 20],
                            [{zoom:12, value:0}, 4],
                            [{zoom:12, value:4100}, 100],
                            [{zoom:16, value:0}, 6],
                            [{zoom:16, value:4100}, 300],
                        ]                                 //setting up proportional circle
                    }
                }
            });

            // Add a LABEL layer to the map
            map.addLayer({
                'id':'denver_count_ped_bike_label',
                'type':'symbol',
                'source':'denver_count_ped_bike',
                'source-layer':'denver_count_ped_bike-17yvzf',  // name of tilesets
                // filter: ['==', 'year', year_v],
                'layout':{
                    'text-field':'{count_}',
                    'text-size':{
                        stops:[[0, 1],[100, 100],[500,400]]
                    }
                },
                'paint':{
                    'text-color':'black'
                }
            })

            // Default filter to map the initial slide value = 0
            var data_year_filter = ['==', 'year', '2013'];
            map.setFilter('denver_count_ped_bike', data_year_filter);
            map.setFilter('denver_count_ped_bike_label', data_year_filter);

            // Create an event listener to the slider so that the "setYear()" function runs when the user changes the slider
            document.getElementById('year_slider').addEventListener('input', function(e){
                var year = parseInt(e.target.value);
                setYear(year);
            });

            // To display a popup
            var mypopup = new mapboxgl.Popup({offset:[150,50],closeButton: false})

            // Another event listener that adds the popup when the user puts their cursor over the tube circles
            map.on('mouseover', 'denver_count_ped_bike', function(e){
                mypopup
                    .setLngLat(e.features[0].geometry.coordinates)
                    .setHTML("<h3>"+ e.features[0].properties.type +" Count </h3> " + e.features[0].properties.count_ + " on " + e.features[0].properties.month + "/" + e.features[0].properties.day + "/" + e.features[0].properties.year )
                    .addTo(map);
            });

            // Change the cursor to a pointer when the mouse is over the stations layer.
            map.on('mouseenter', 'denver_count_ped_bike', function () {
                  map.getCanvas().style.cursor = 'pointer';
            });

            // Change it back to a pointer when it leaves and remove the popup window.
            map.on('mouseleave', 'denver_count_ped_bike', function () {
                map.getCanvas().style.cursor = '';
                mypopup.remove();
            });

        })


</script>

</body>
</html>
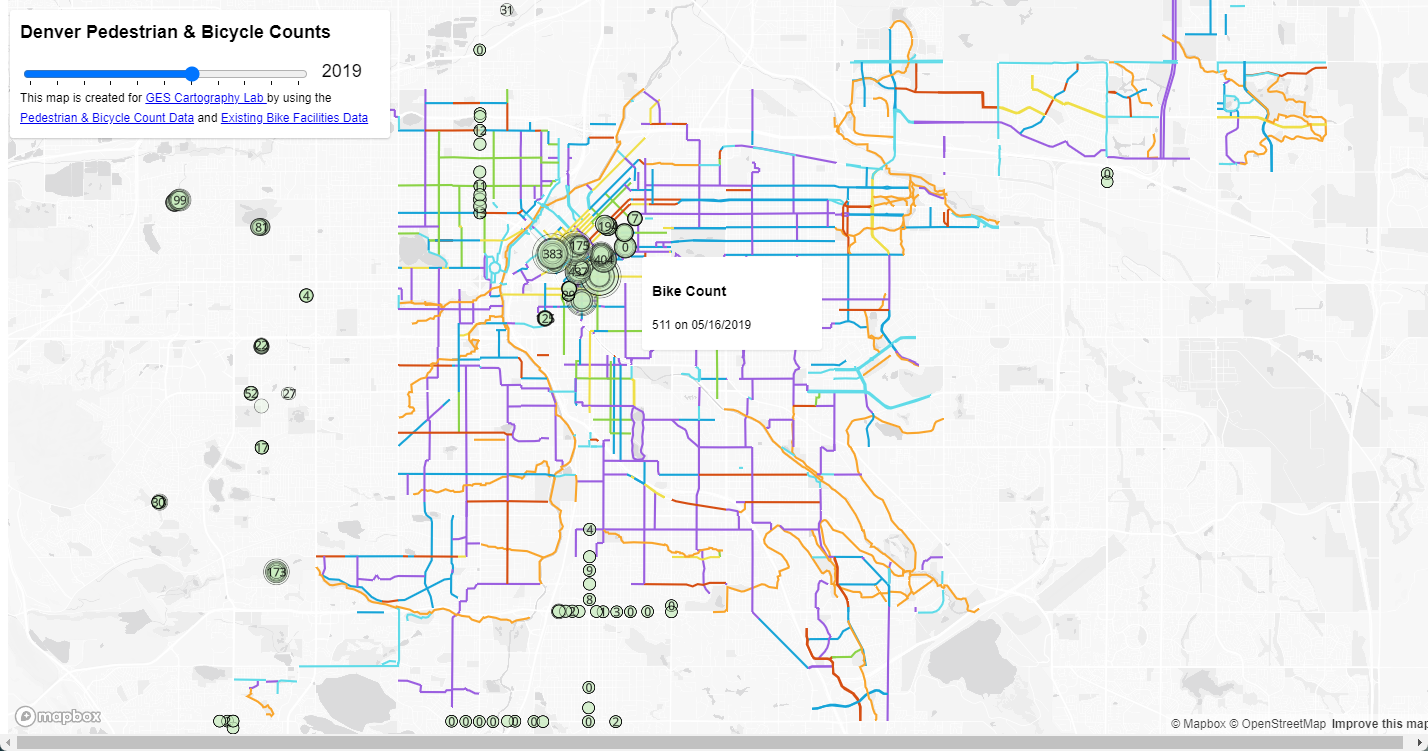
When you double click on the html file you have created, it should open in your default web browser software, and show a map as the image below.
Lab Answer E10 - Season Slider
– WILL REVEAL LATER – Please see the following script to create a Season slider based on the code of Example 10. Since this script imports “Mapbox_example10_styles.css”, you need to place these two files in the same folder.
Further Materials on Mapbox
We will look at further Mapbox examples after the spring break, including some 2.5D mapping and camera controls. Mapbox have created a powerful and flexible set of tools that can be used on lots of different types of spatial data, and offer users a variety of different interaction possibilities.
- A good overview of the entire Mapbox tool suite is found here: https://www.mapbox.com/help/how-mapbox-works/
- There are also some great Mapbox.gl JS examples online that you can look at: https://www.mapbox.com/mapbox-gl-js/example/simple-map/
- These examples include some nice feature like updating a layer dynamically by zoom level: https://www.mapbox.com/mapbox-gl-js/example/updating-choropleth/
- A time-slider of event data: https://www.mapbox.com/mapbox-gl-js/example/timeline-animation/
- A slideshow of camera ’fly-to- events: https://www.mapbox.com/mapbox-gl-js/example/scroll-fly-to/